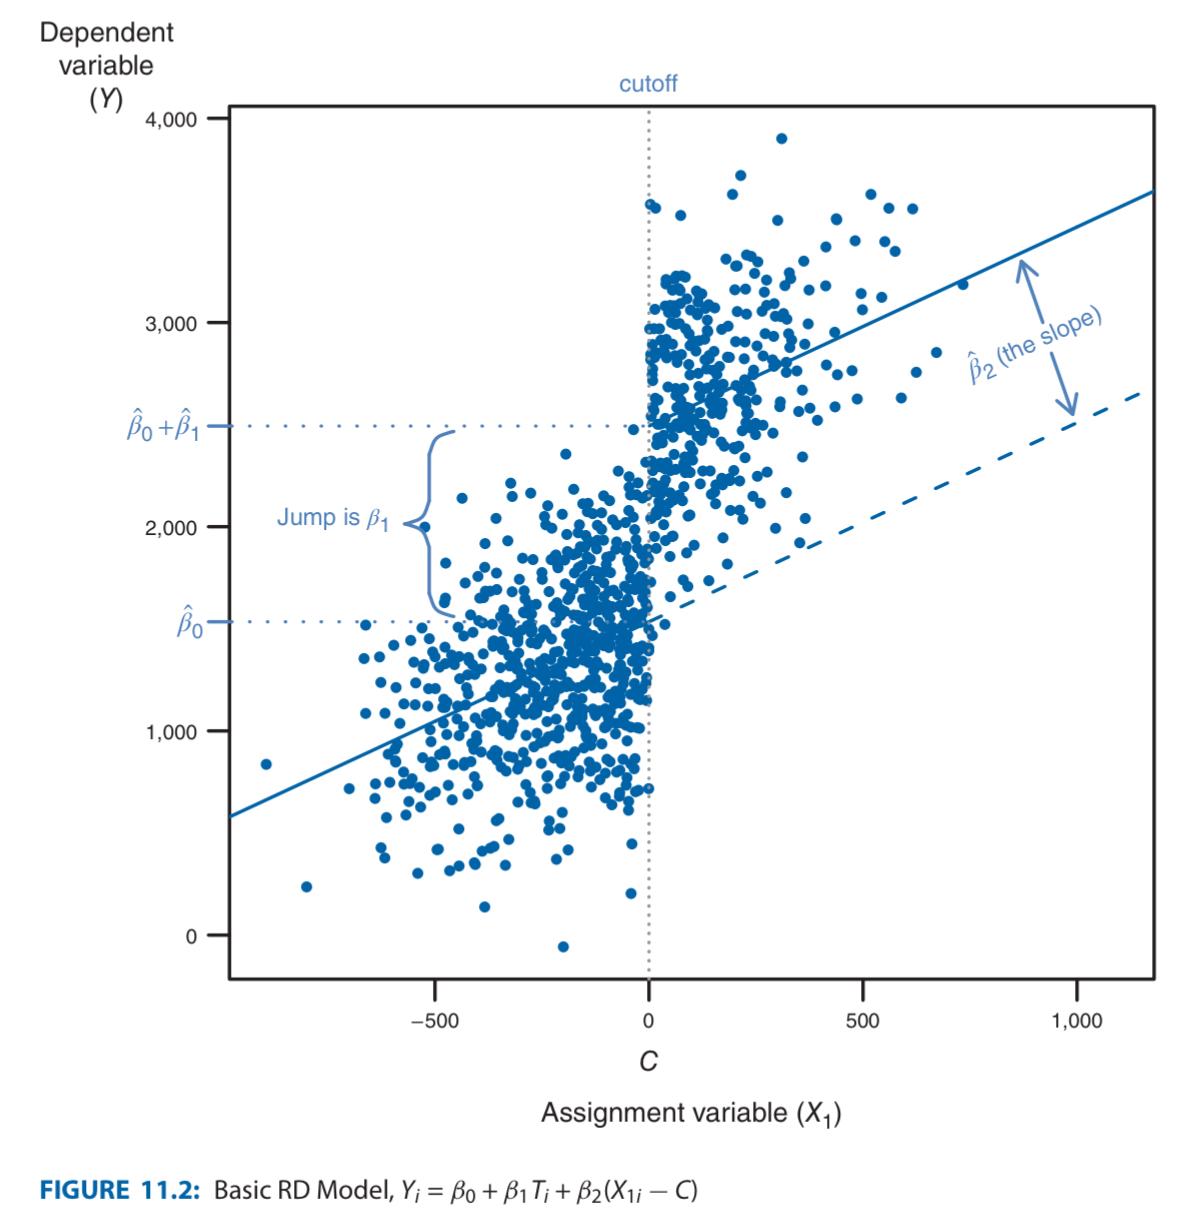
Regression Discontinuity analysis is useful when
- The assignment variable (independent variable) is continuous (not binary)
- “Treatment” thus simply means after-cutoff
- We can’t just use Difference of Means because the assignment variable continuously changes in each groups too and thus affects the dependent variable too.
- No other factors change when crossing the cutoff Then we can use the basic (constant-slopes) RD model:
where:
-
is the cutoff point
-
is for post-cutoff, for pre-cutoff. Simulates “treatment”
-
is the assignment variable (non-adjusted). where coefficients mean:
-
is the causality of treatment
-
is the causality of the assignment var

-
Error term shouldn’t be jumping at the cutoff, i.e. we should have
- If then thus the basic RD model from above becomes:
- → Thus even if $\rho_{X_{1},\epsilon}\neq 0$, $\hat{\beta_{1}}$ is unbiased (i.e. still correctly indicates the causality between treatment and $Y$)!
- But $\hat{\beta_{2}}$ no longer indicates causality between $X_{1}$ and $Y_{i}$, instead just indicates. overall correlation.
Advanced RD
We don’t need to limit ourselves to have the slopes be same before and after discontinuity by using the varying slopes model:
Smaller windows → probably linear
Issues with RD Analysis
- Smaller window (=bandwidth): We must look at variables close to the cutoff (because the farther away you go, the more endogenity there might be) But this isn’t always possible because of limited sample size.
- Probably only estimates the Local Average Treatment Effect (LATE), meaning that you can’t generalize the results. (“Are effects of drinking (vial legal age) on grades affect babies? old econometrics professors?“)
- Multiple variables usually determine treatment or not. (medicare and age is clear-cut; SAT and college admission isn’t) → use Fuzzy RD model
- Or, we can use the Balace Test to see if the side of the cutoff is truly random
- Error term jumps at discontinuity (the issue from above)
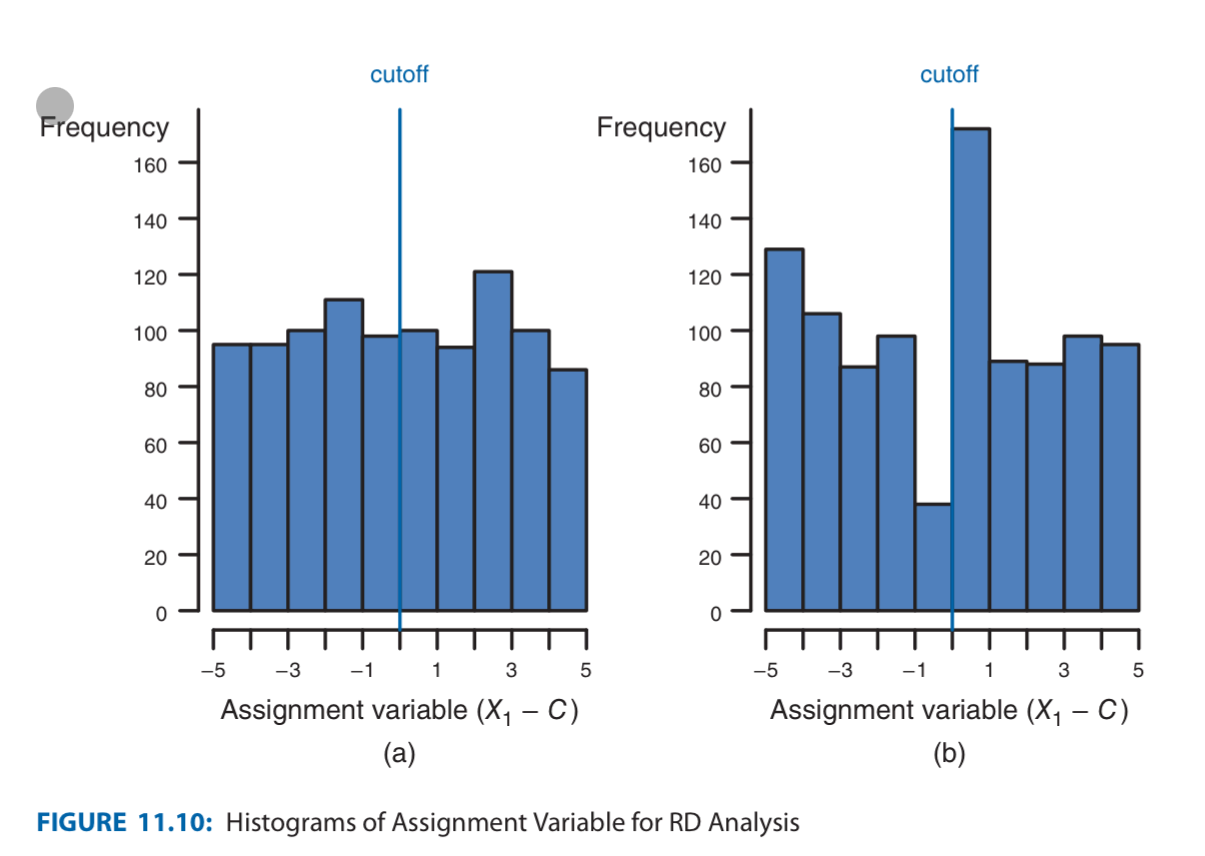
- To check, make sure the frequency of the assignment variable is smooth at cutoff (e.g. the number of people (=samples) with SAT scores just below 1500 and just above 1500 isn’t too different from the rest of the grade.)
- If there is, it might mean that people under 1500 wanted to get into colleges with cutoff score at 1500, so studied a little bit harder.
- Visualization.

- Another way to check this is to run regression between covariate (which we suspect to be in the error term) and the RD model:
- A Statistically significant indicates is in the error term
- To check, make sure the frequency of the assignment variable is smooth at cutoff (e.g. the number of people (=samples) with SAT scores just below 1500 and just above 1500 isn’t too different from the rest of the grade.)