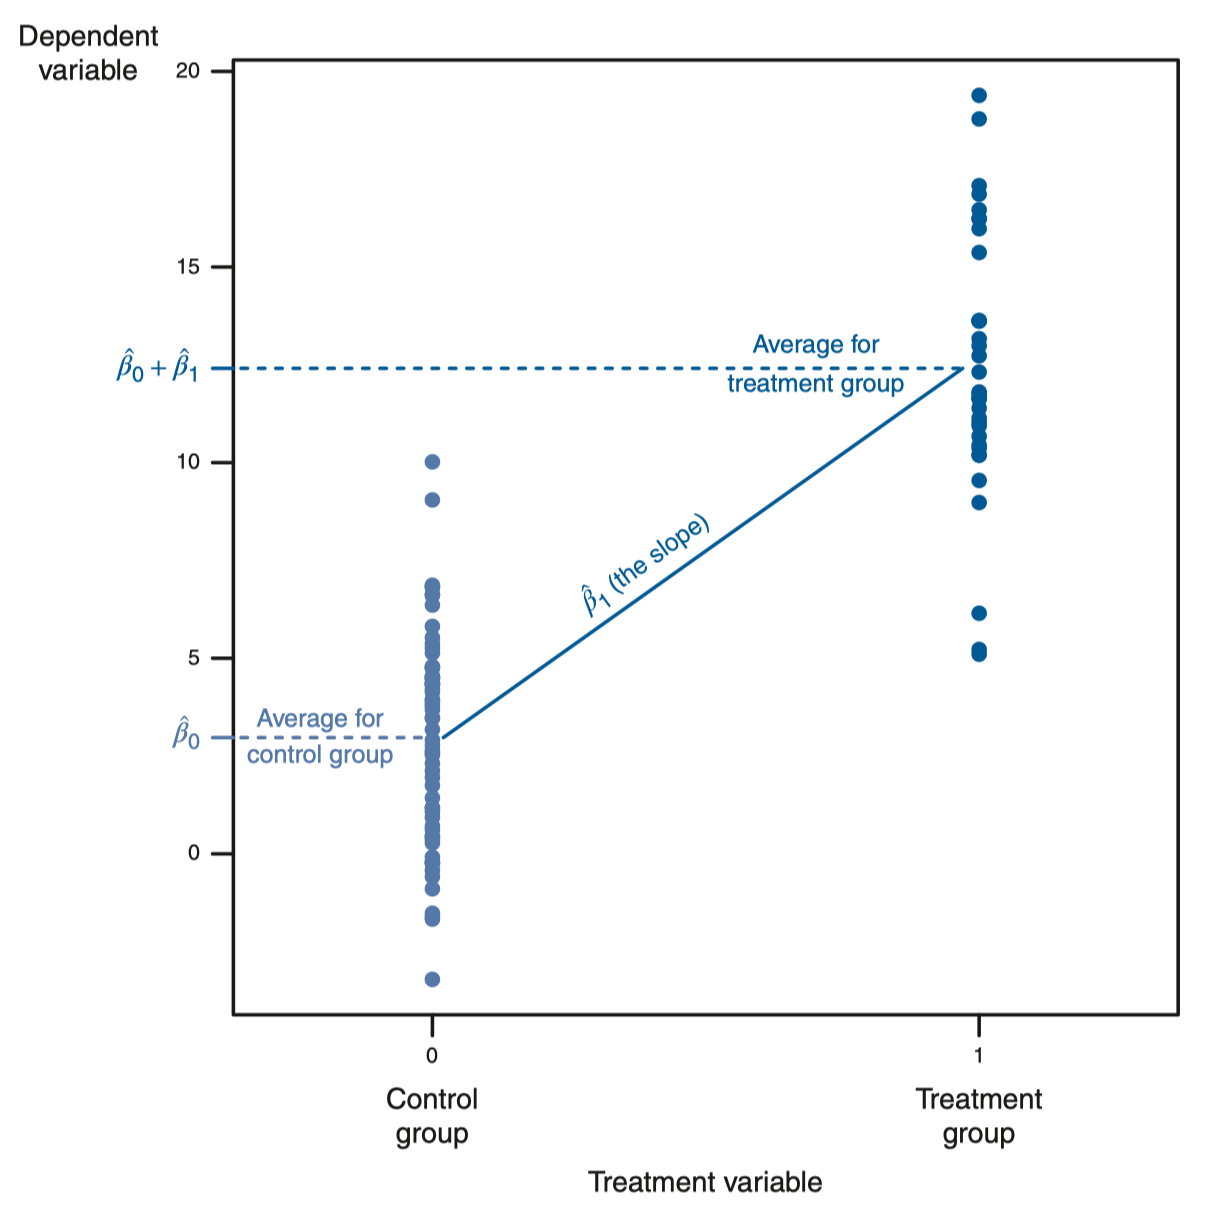
Motivation. A treatment vs. Non-treatment group in medicine. A dummy variable in this case would be:
And regression:
- Fitted value:
- if ← “average of treatment group”
- if ← “average of control group”
- This is equivalent to performing a Difference of Means Test, which measures the difference of the mean of each group.
- The difference of means is (=the treatment effect)
Multiplicative Dummy Variables
Motivation. Gender pay gap is not an “additive” factor but a “multiplicative” factor, as it men are rewarded more for per unit experience than women. In this case we can model:
Regression Plot: 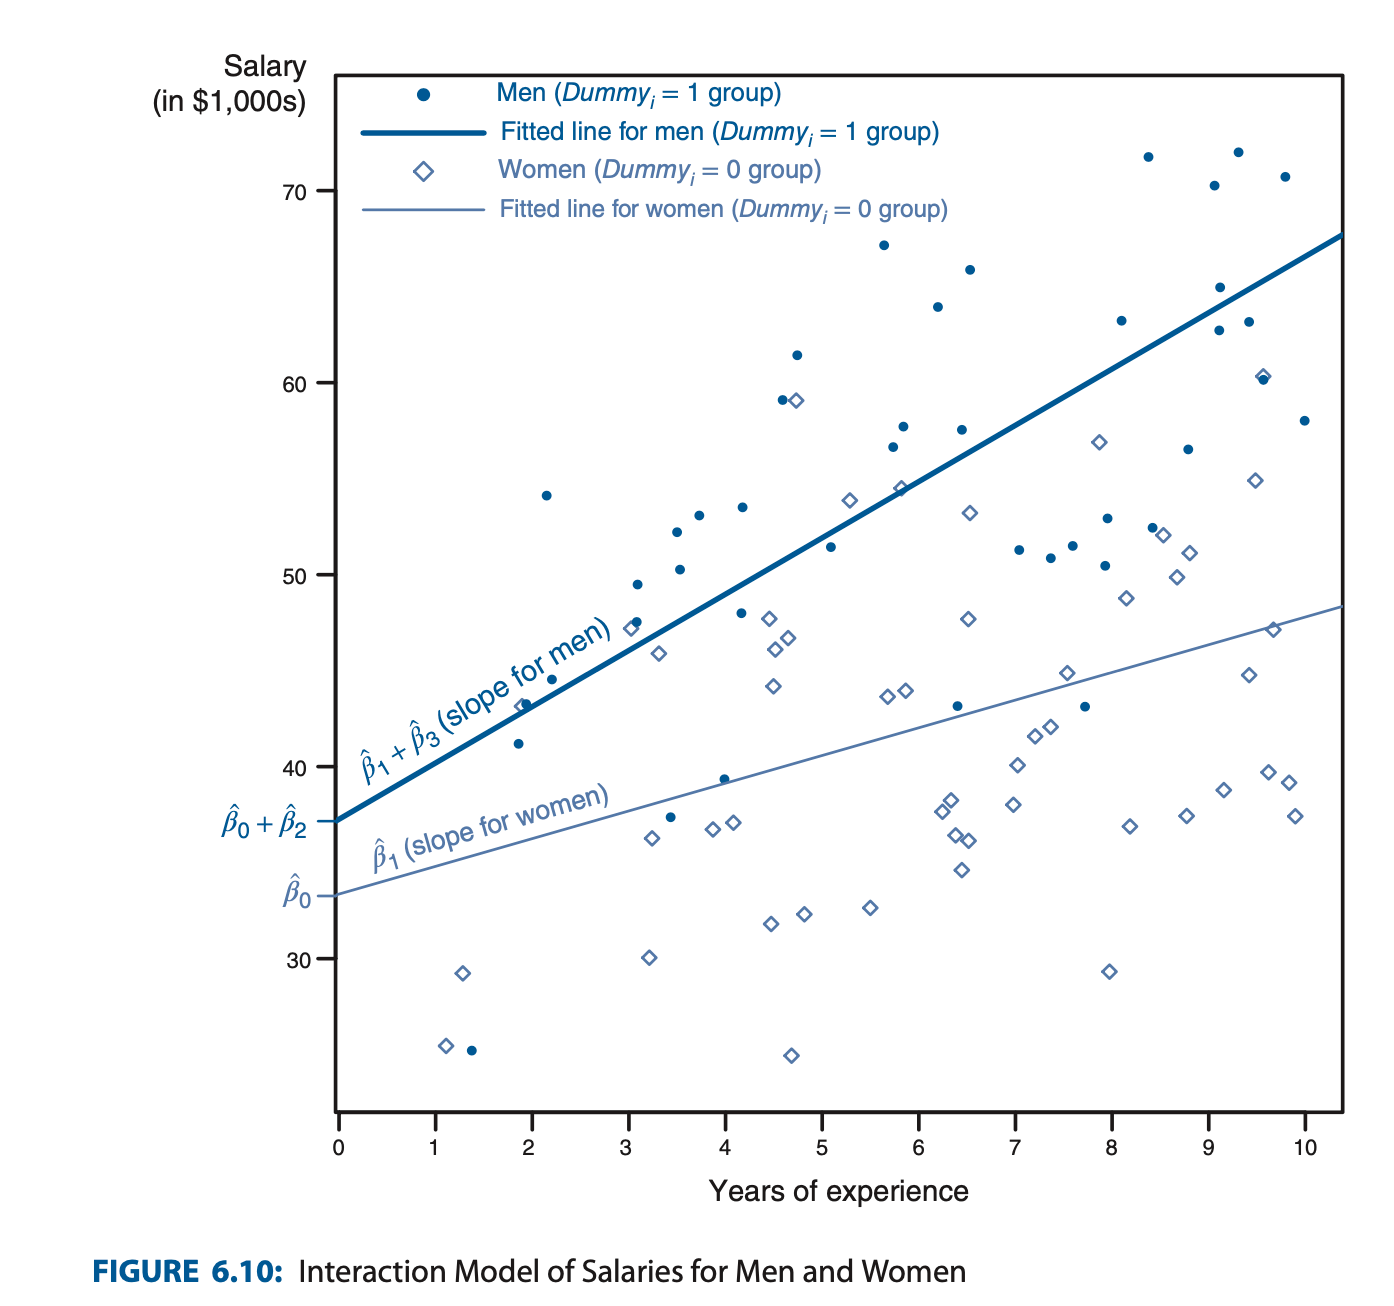
- is the slope of non-treament group (=women)
- is the slope of the treatment group (=men)
- Therefore Graph shape is:
- determines the slope (upwards/downwards sloping)
- will increase or decrease the magnitude of the slope in the treatment (men) group depending on its sign
- ! When using multiplicative dummy regression, in order to test for statistical significance of you must test additive and multiplicative term parameters together, i.e. using F-statistics to test
- The total effect of is , and the statistical significance is tested by
- In general, if just one of either or is individually significant the total effect is significant
Applications of Dummy Variables
Dummy Independent Variables in Multivariate OLS
Model:
→ will tell us the difference between the groups and
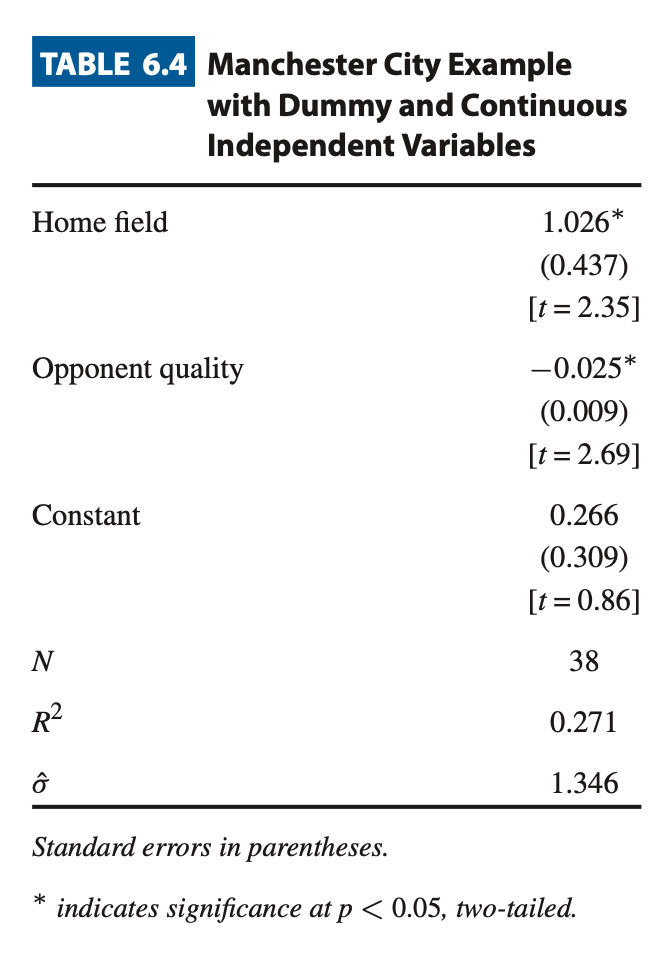
Example. How much does playing in home field create an advantage for the home team?
- Adding will control for opponent quality
- Regression Table
- Regression Plot
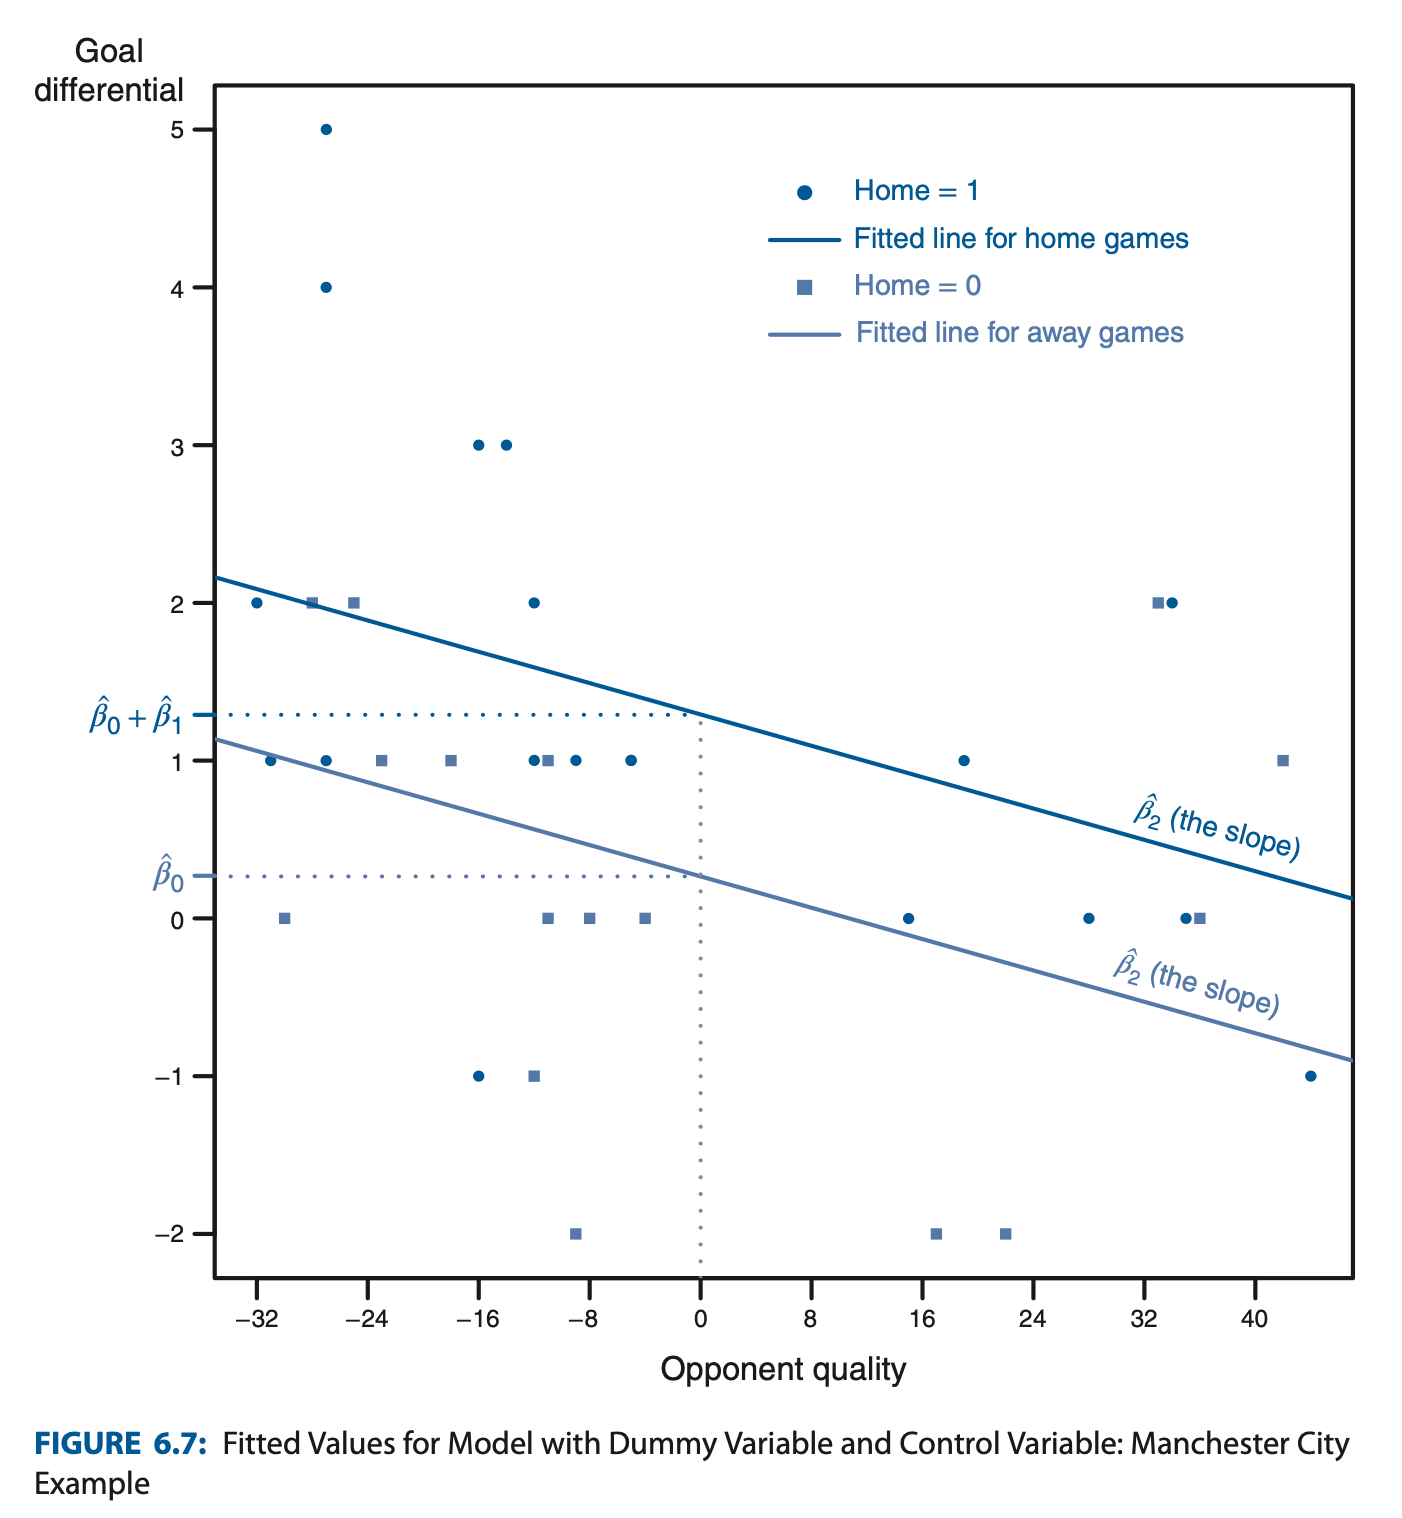
- At , the difference in means in
- is irrelevant for this difference of means test. But if you want, it’s the slope between opponent quality and goal differential
Categorical to Dummy Variables.
Motivation. This is useful when you have categories like “1 indicates a person is from the Northeast, 2 from the Midwest, 3 from the South, and 4 from the West,” and you want a difference of means test for all of them combined. You can’t simply use the 1,2,3,4 as values because it “location” is not a quantity but a category. You use binary dummy variables instead:
- We don’t need a because on all three dummy variables indicates obviously that that datapoint is from the west. (i.e. avoid the “dummy perfect multicollinearity trap” where e.g. is perfectly negatively correlated with ).
- i.e.g there cannot be any two categorical dummy variables which are both one.
- Interpretation, e.g. for : the unit rise in wages by moving from reference (West) to NE.
- Regression Table:
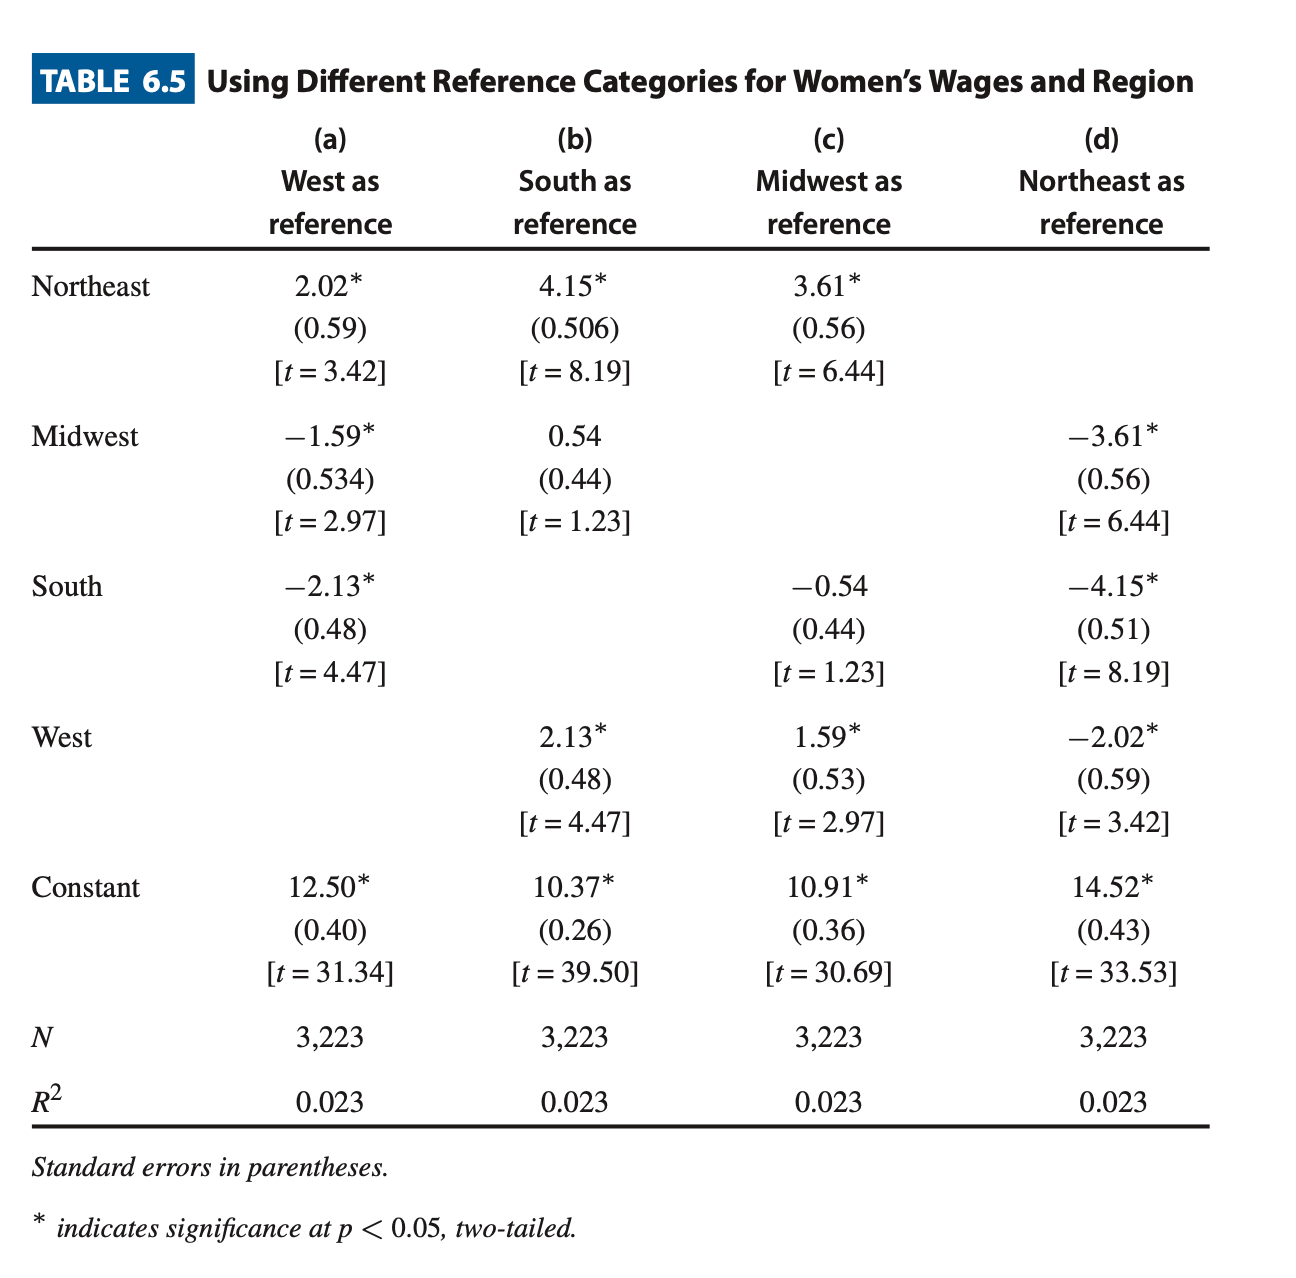
- Observe that all columns are symmetric. The model we used above is column (a), but since there are many other ways to define categories as dummy variables, we are showing that they all have the same result.
- & Each row represents “how better it is from the reference”; in (a), “how better is it from the west”.
We now have an example from the textbook that incorporates these. Example. Taxation vs Male suffrage, Year, War mobilization and location
- Regression Table:
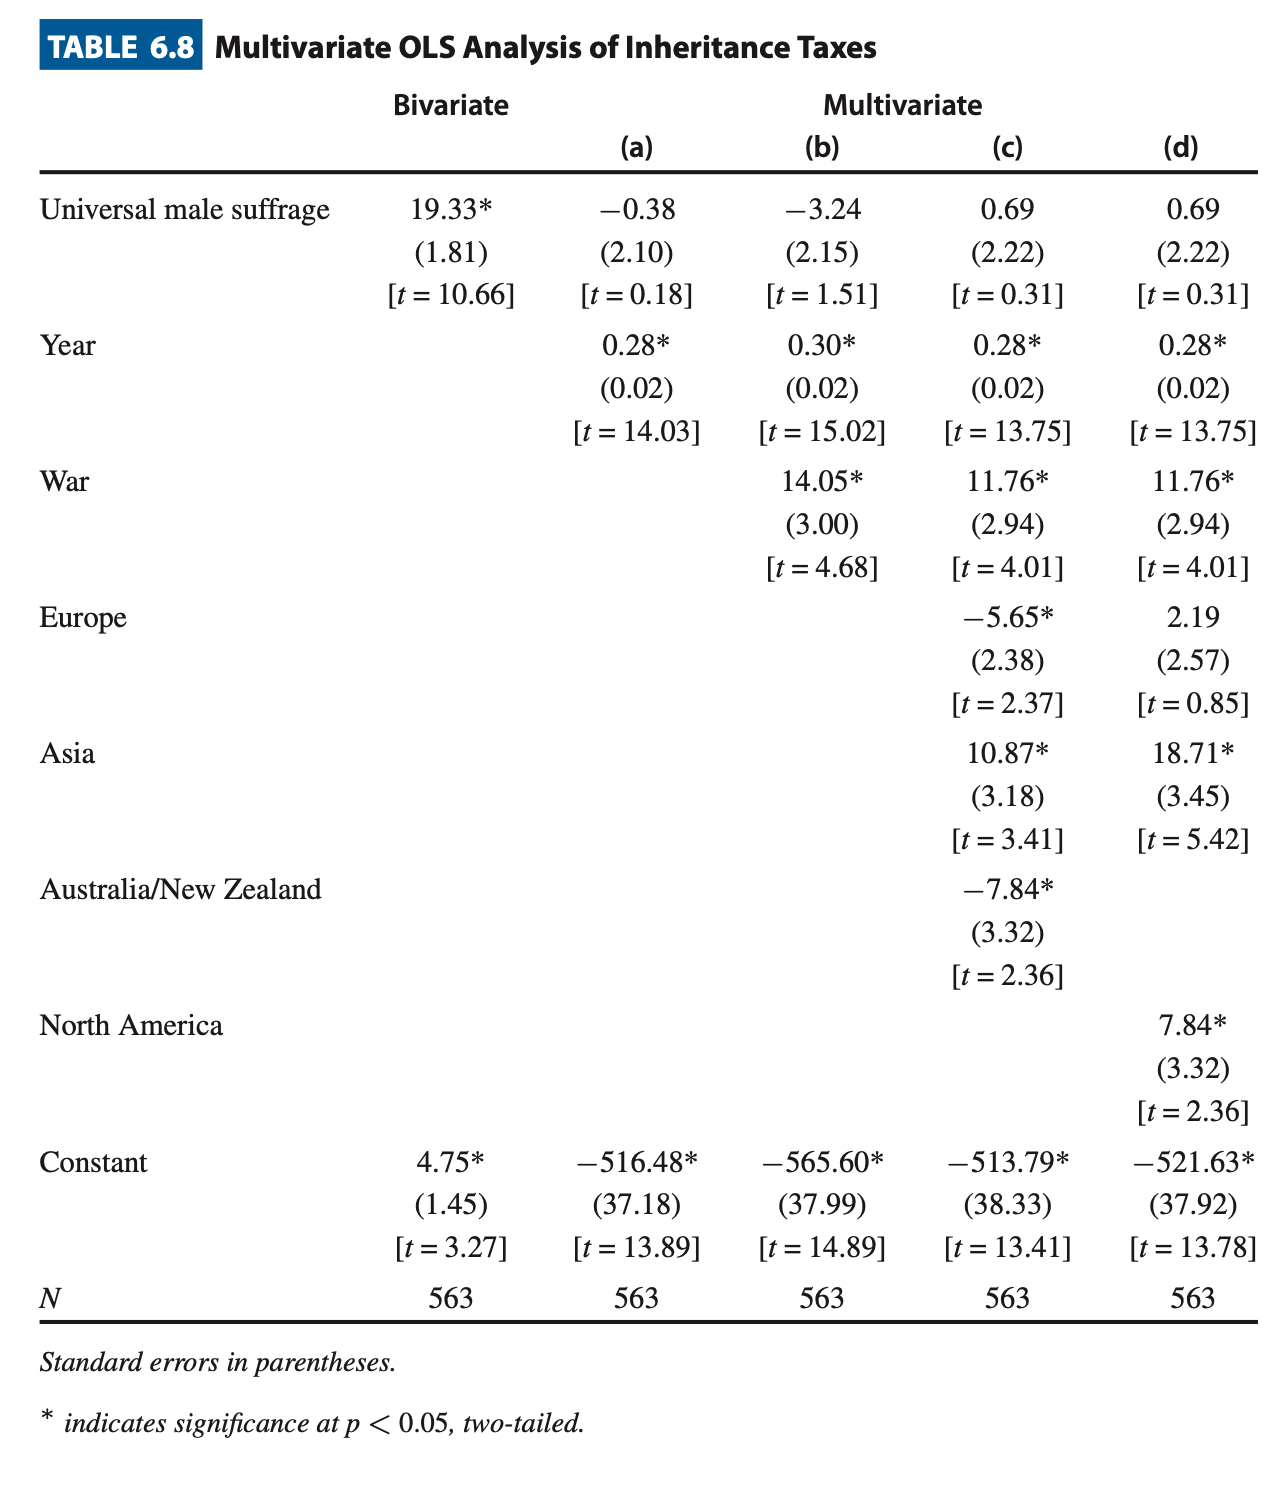
- “Bivariate” column is the stupid model.
- (a) only adds the year. Year is significant endogenous factor
- (b) adds war. War is also a significant endogenous factor
- (c) includes location dummies, with North America as the reference (therefore model doesn’t include ).