See also: Confidence Intervals and Hypothesis Testing
Motivation. Assume we have our estimators for our sample size using OLS, . Now, assuming we have the true population data (impossible in real life) and take samples of size from the whole population, we get different tuple of estimators . If we plot these on a graph, we get an approximate bell curve. This is due to the Central Limit Theorem. Knowing this fact, we can deduce if there is a correlation between and .
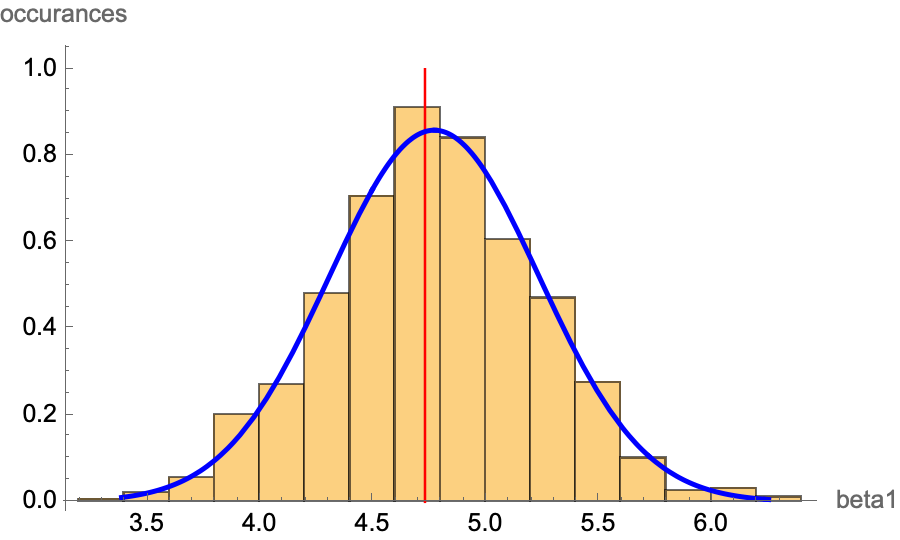
Remark. is the minimum required for CLT. is a conservative requirement for CLT to apply. Remark. We will only look at since it is the more important parameter.
Hypothesis Testing
def. The Null hypothesis in regression is , i.e. there is no correlation.
def. Regression T-test. See Student’s t-test. A T-test is a test for rejecting the null hypothesis. let the T-statistic . Then
- The cutoff value is determined by how powerful (=) you want the test to be. This is determined by the Student’s T-Distribution.
- This is because
- This is Student’s t-test but with only one random variable.
- Normally, we set the cutoff , i.e. two standard deviations away. This is around an test.
Table of common T-Statistic values
| Value of T | Significance | Sidedness |
|---|---|---|
| Two-side | ||
| Two-side | ||
A Large-sample critical value is simply using the idea that as the i.e. the statistic becomes a normal distribution. Thus the cutoff values are using the standard normal table.
Intuition. 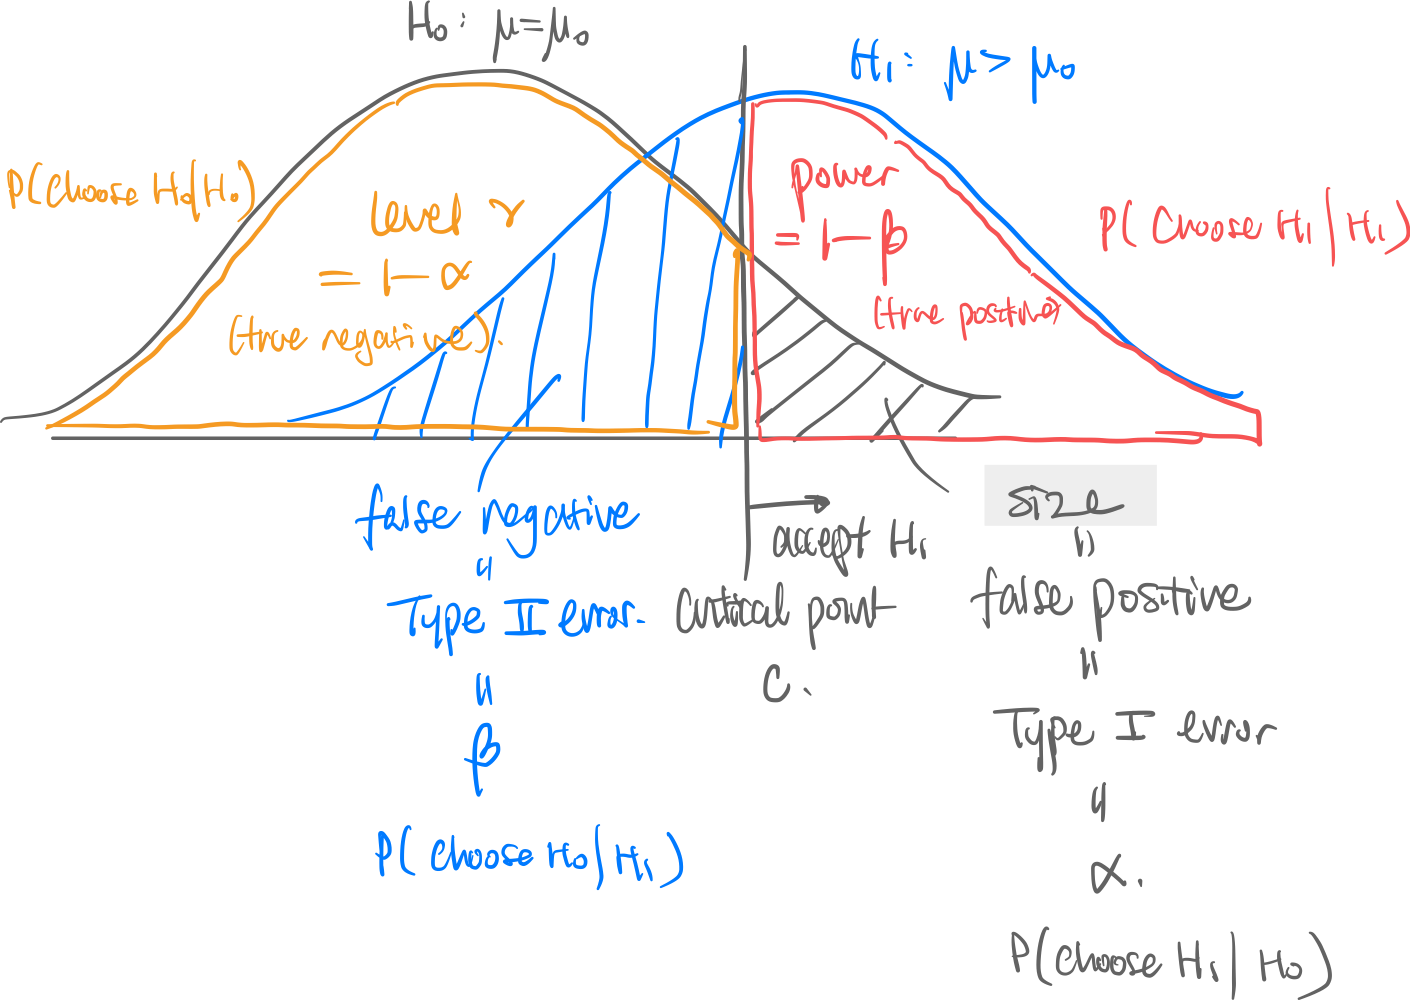
Confidence Interval
Intuition.
Bias:
standard error of regression: mean squared of residuals; also the estimator for the error
Standard error of…
- Residuals → standard error of regression
- Varaince of is also the variance of CLT limit with the same sample size
Remark. Substantive significance does not imply statistical significance, nor does vice versa. The two are irrelevant.