Motivation. Let us imagine a tuple of data generated by two independent RVs: , as graphed below. 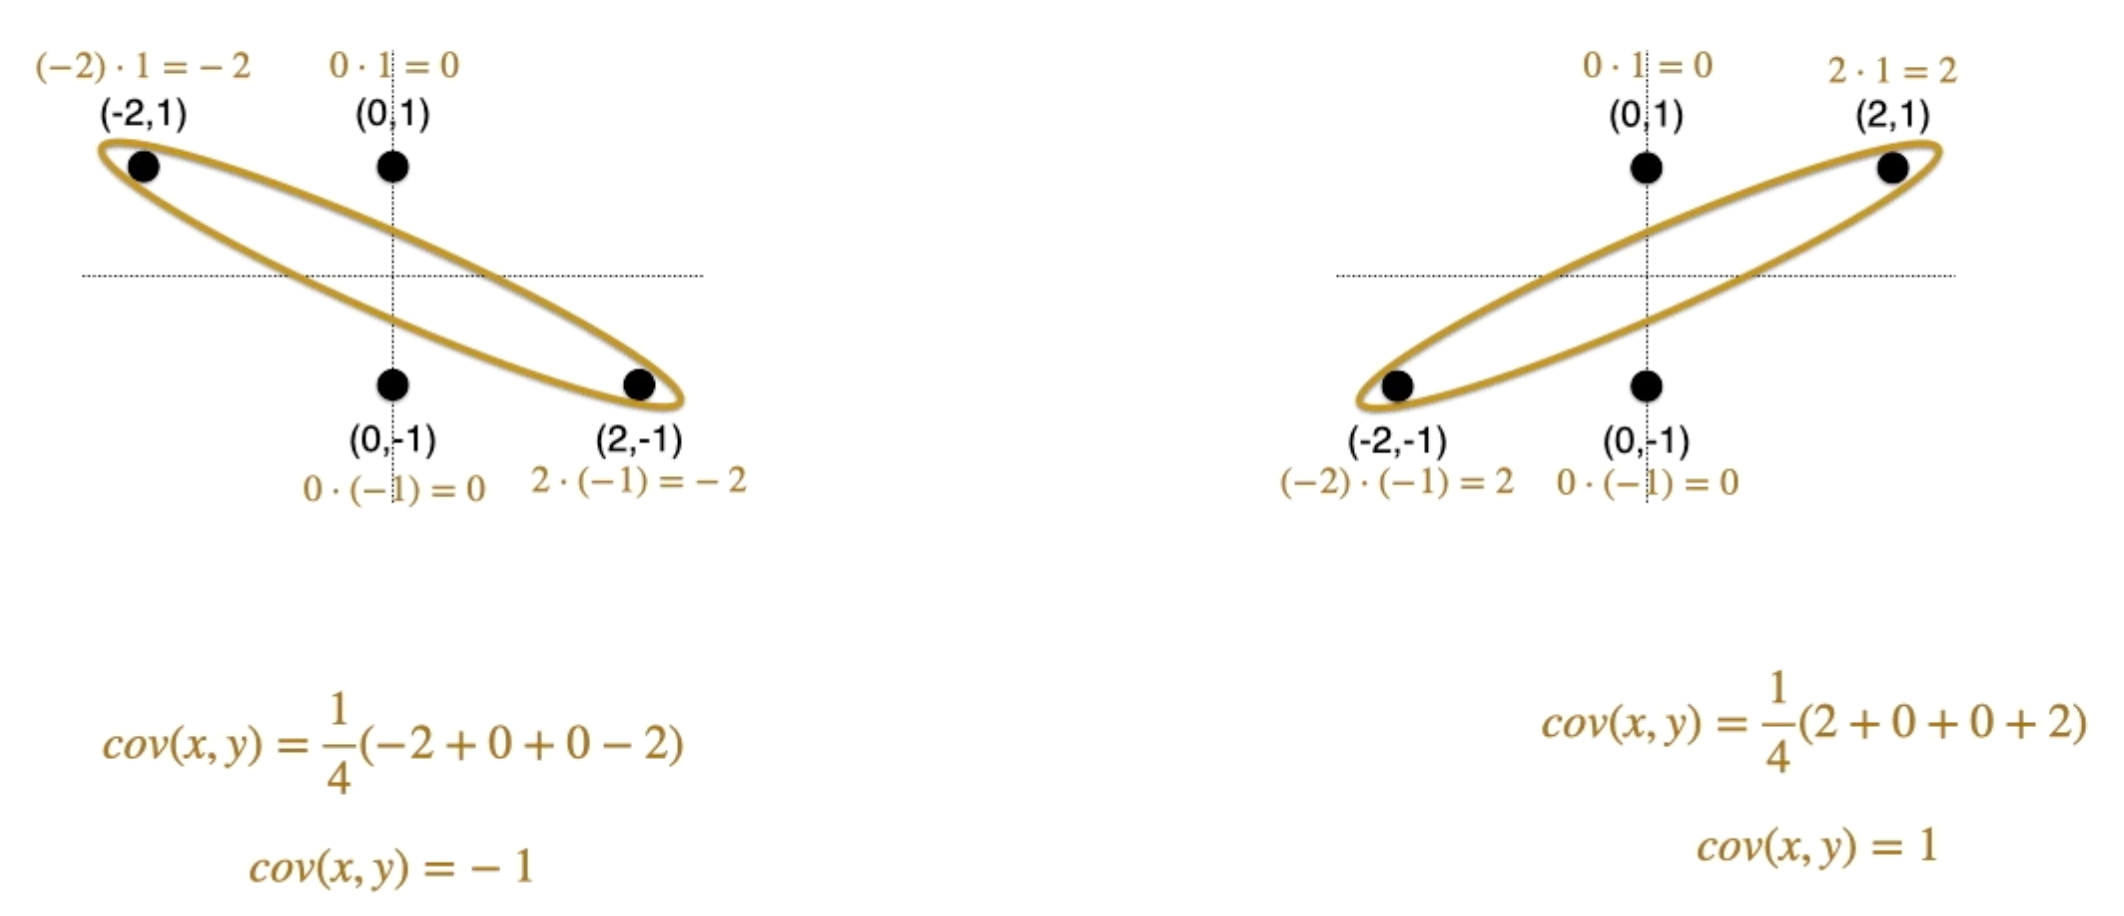
- for both
- for both
- …but the ‘spread’ of these two are clearly different! There, we observe that what matters is the ‘quadrant’ or ‘direction’ of the spread that matters, and that is captured by multiplication of the two coordinates. Thus: Intuition. Covariance is the “average quadrant” of the direction of spread. The covariance matrix from 5:06
def. Covariance. Covariance measures the joint variability of two R.V.s; let .
- When show similar behavior,
- When show opposite behavior,
- When , then ; but does not imply
- Covariance is a generalization of Variance:
thm. Relationship between Covariance and Variance. let . then:
- When then
thm. Bilinearity of Covariance.
thm. Summed Variance. let . Then
E.G. second summation has terms:
Covariance Matrix
def. Covariance Matrix is a collection of covariances for RVs:
where is the covariance
- Always symmetric
- Determinant gives