Gentle Introduction
def. The Capital Asset Pricing Model (CAPM) is a method of predicting the returns of an asset, by using regression analysis between it and the market’s returns.
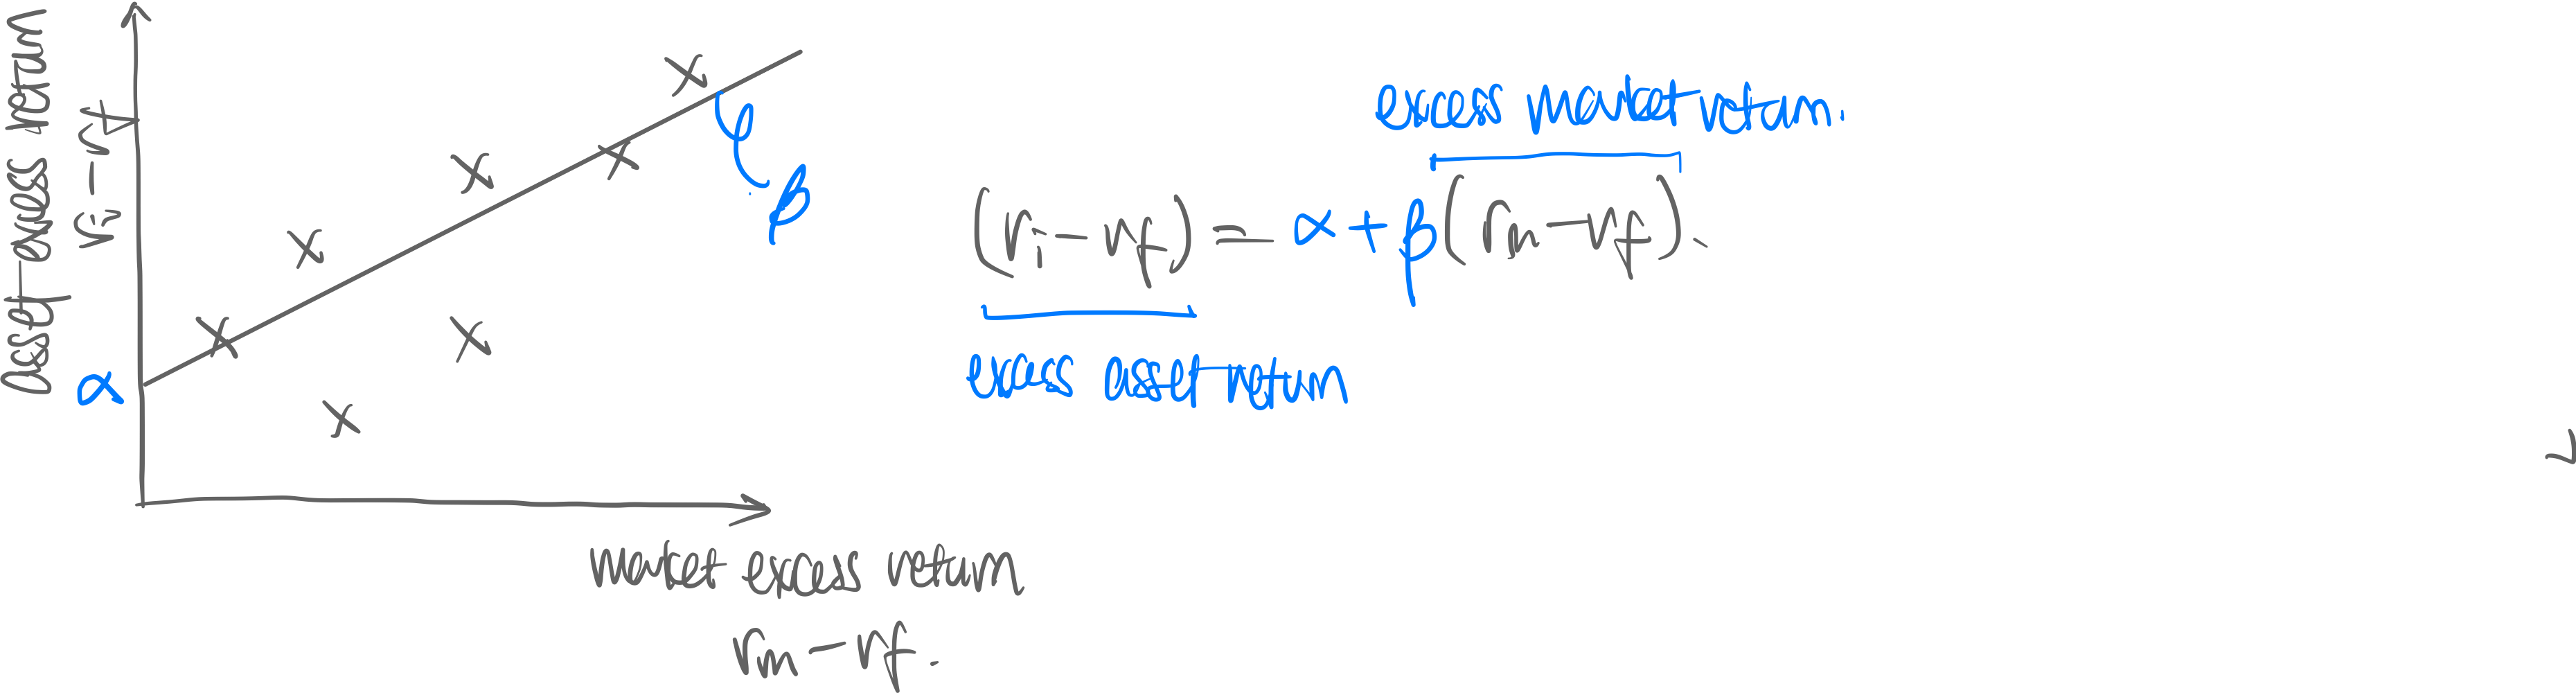
The regression line has the equation:
Data correlates between market excess return () and asset excess return (). The statistics produces the following data:
- Coefficient of Determination [=R-value] , measures the goodness of fit. Bigger means the model is a better fit.
- Standard deviations [=Risk (Finance)]
- Correlation coefficient , measures the degree of correlation between the two variables
- Market Beta [=slope ] , which measures the sensitivity of one variable to another. It doesn’t deviate much from 1.
- Alpha [=intercept ], which measures the excess return against all odds (of the prediction of the CAPM model.) It should, theoretically, always be zero. But it is not (See Jenson’s Alpha below.)
If we plot riskless assets with a riskful asset:
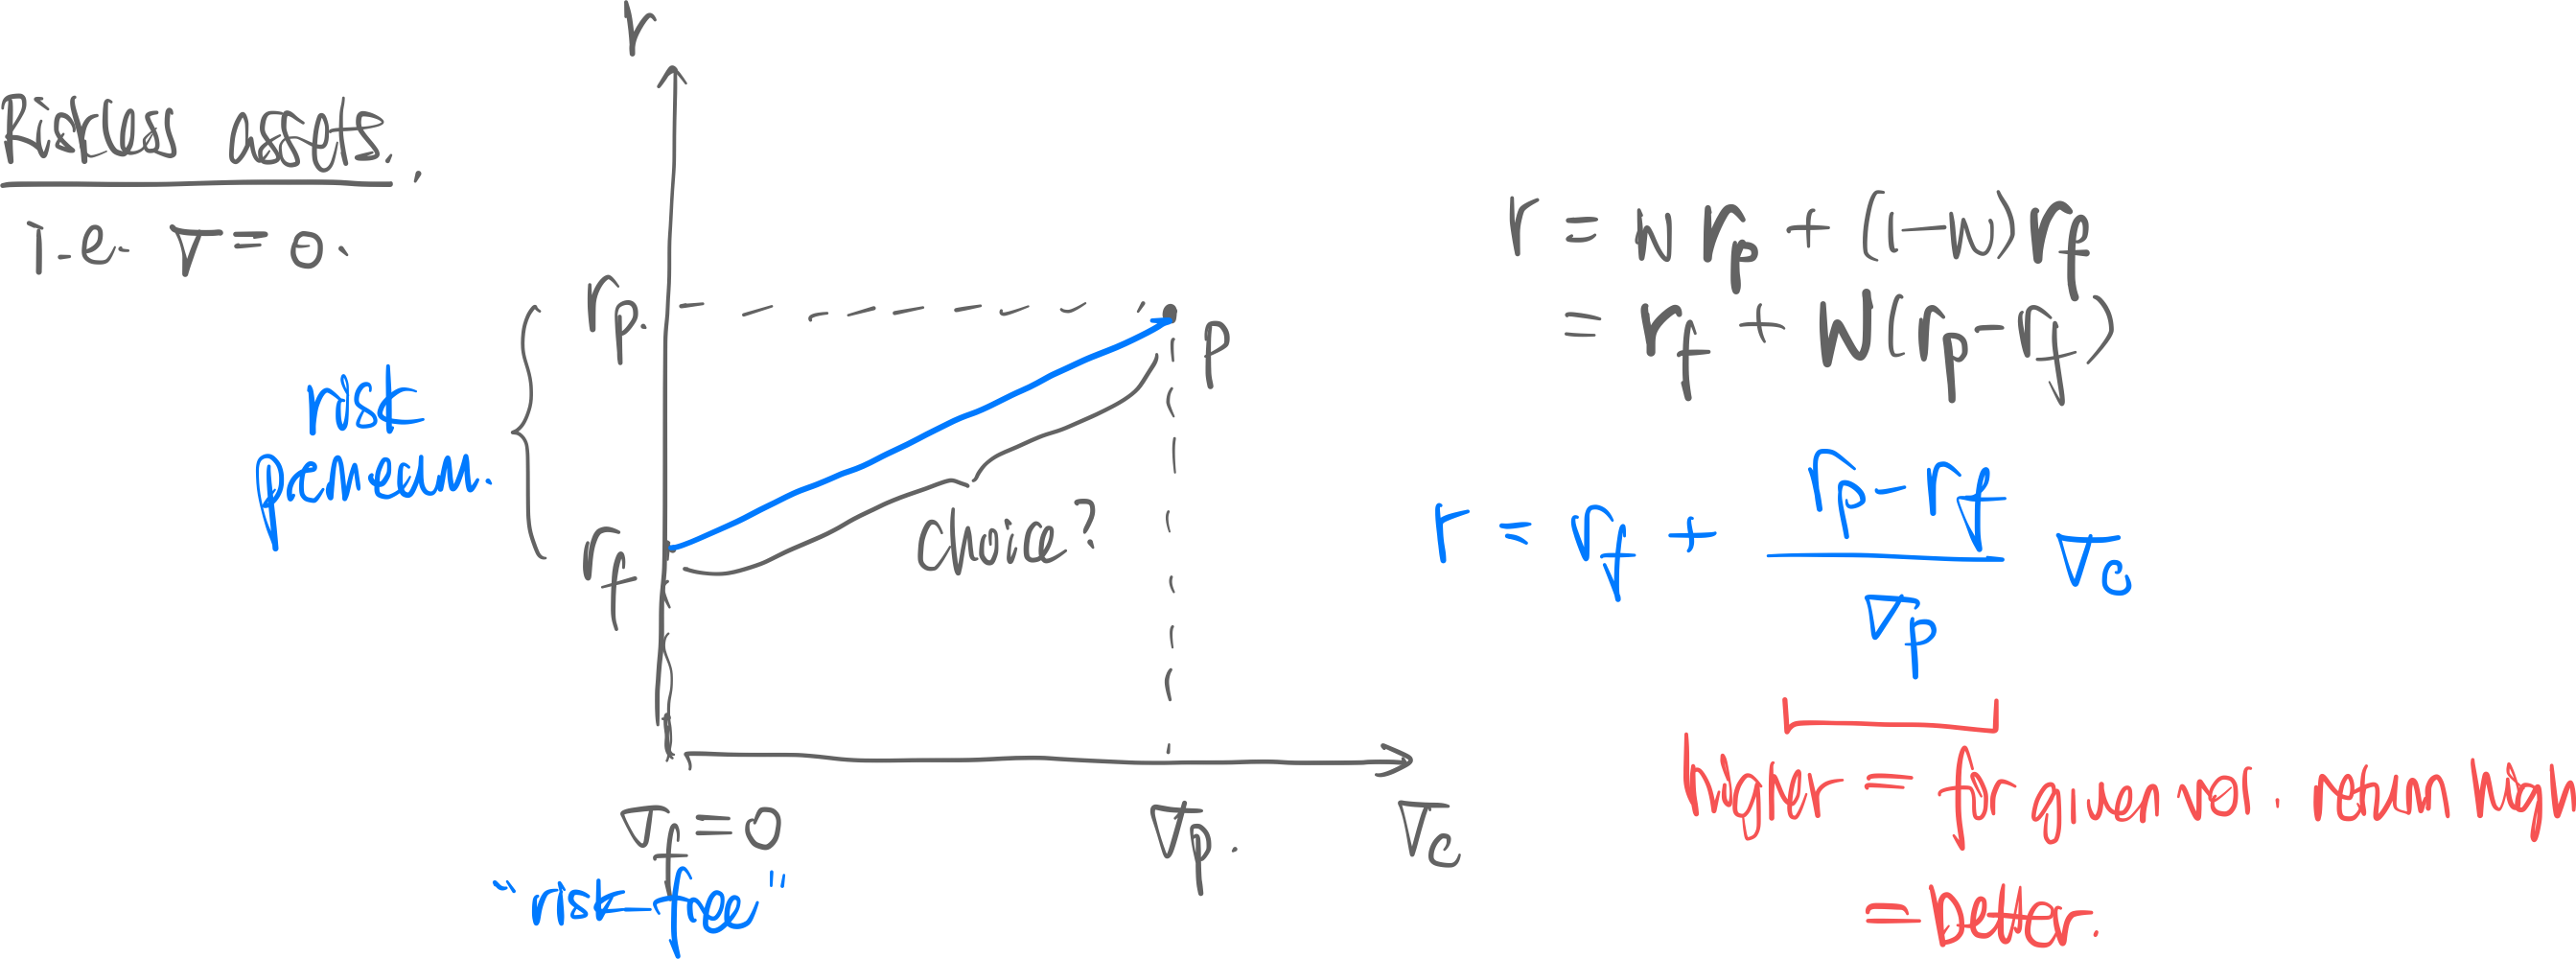
- is the riskless return, is the riskful asset’s return, and is the weight of riskful assets in portfolio.
- is the volatility for the riskful asset, and the volatility of riskless asset, is zero by definition
- Gradient of the blue line is ← this is a constant. Thus the blue frontier is linear.
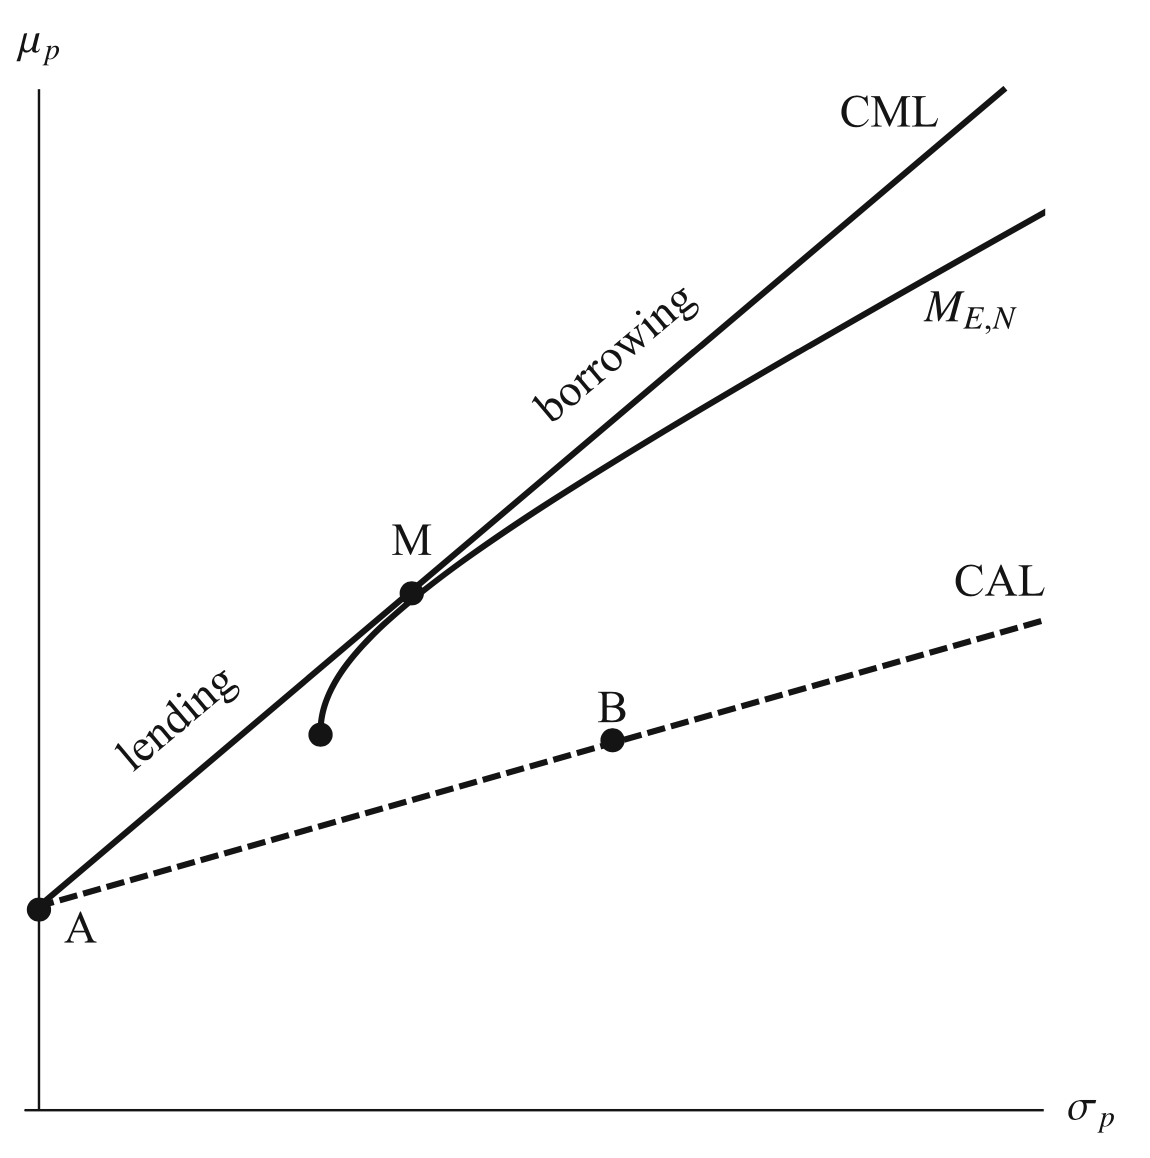
⇒ With riskless assets, you can short-sell the riskless asset to go beyond the risk/return:
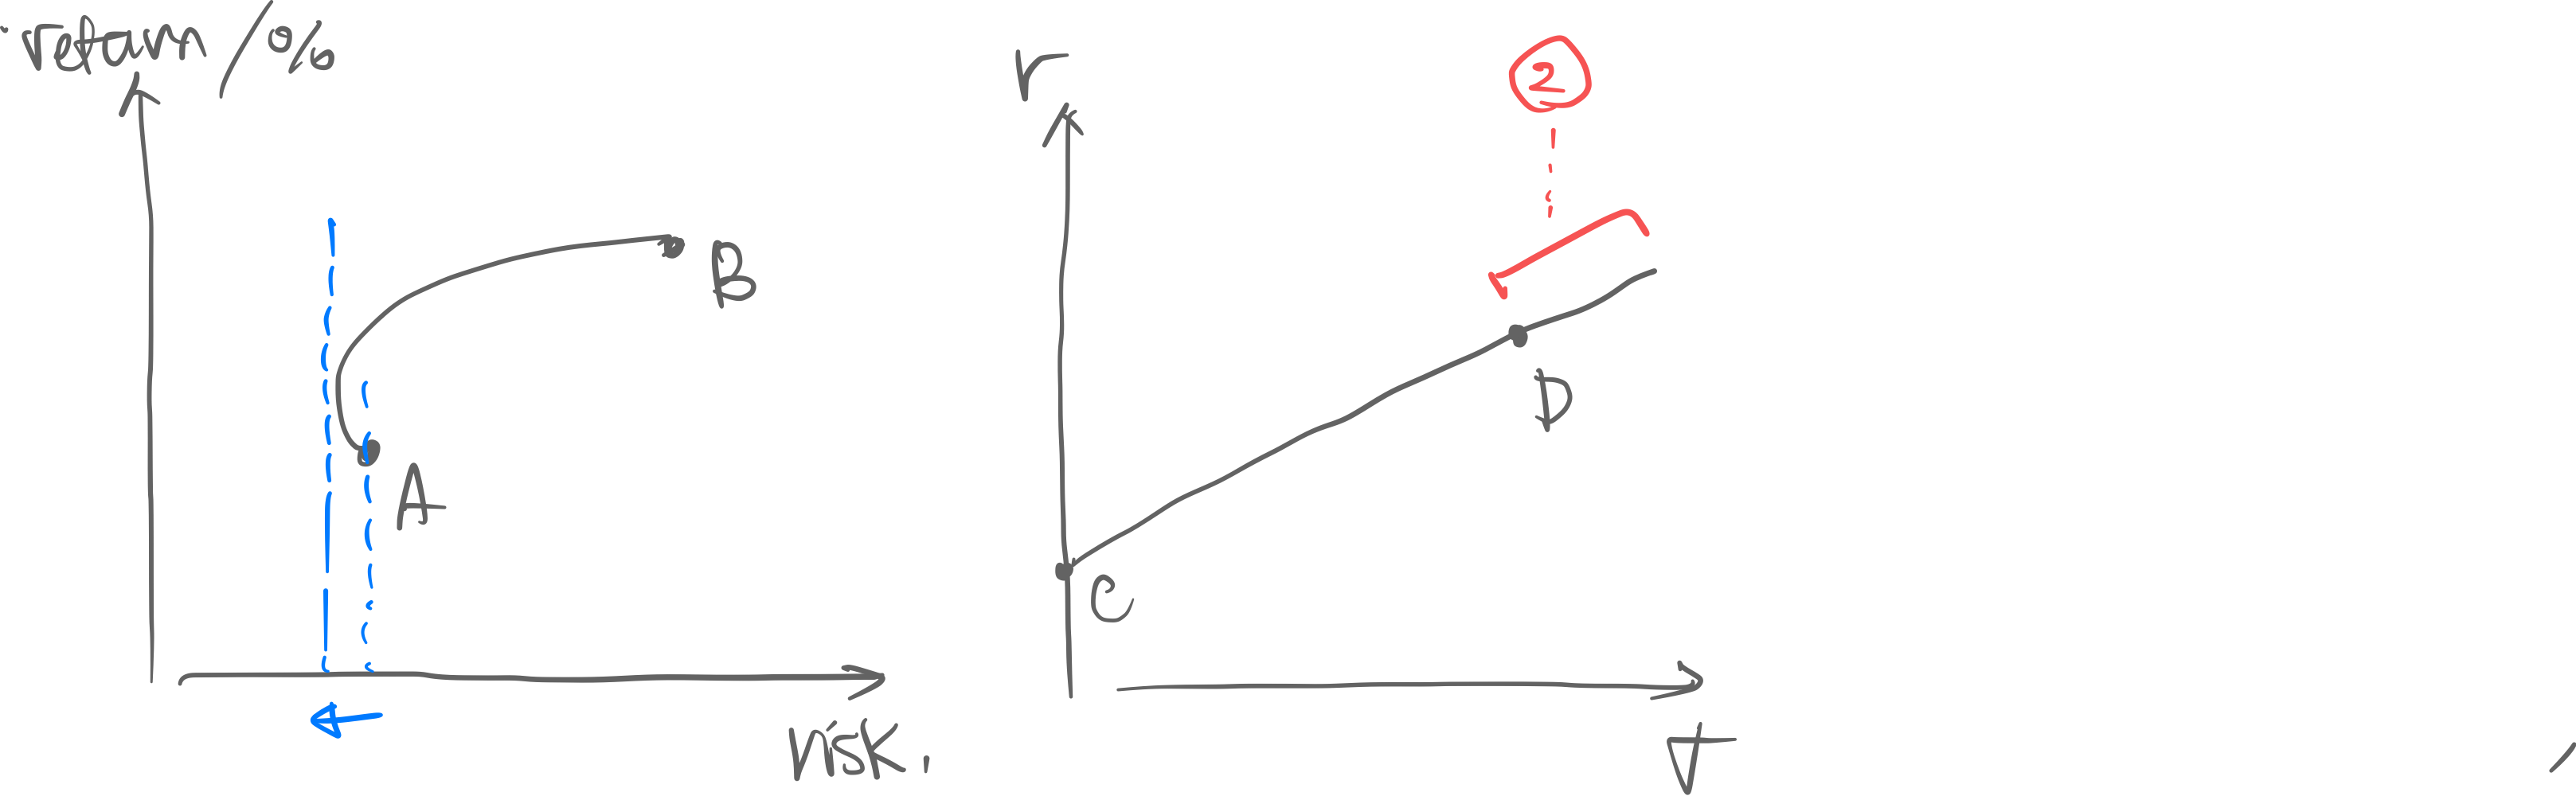
(2) is achieved by short-selling the risk-free asset and purchasing more of the riskfull asset.
- This is also called Leverage.
- This means that the weight on the risk-free asset is negative
- …and the weight on the risk-full asset is
- If the risk-free rate ever eclipses the risk-ful rate, disaster insues. (This is what happened during the financial crisis of 2008; banks were highly levered.)
Combination of Risk-ful—Risk-free & Risk-ful—Risk-ful
6~7%.
Note that the axes are not market returns, but **excess returns**. This means usually the y-intercept will be zero, unless as we later discuss $\alpha >0$.
Sensitivity vs. Asset Return. If the data shows the asset’s return is higher, then the sensitivity should increase.
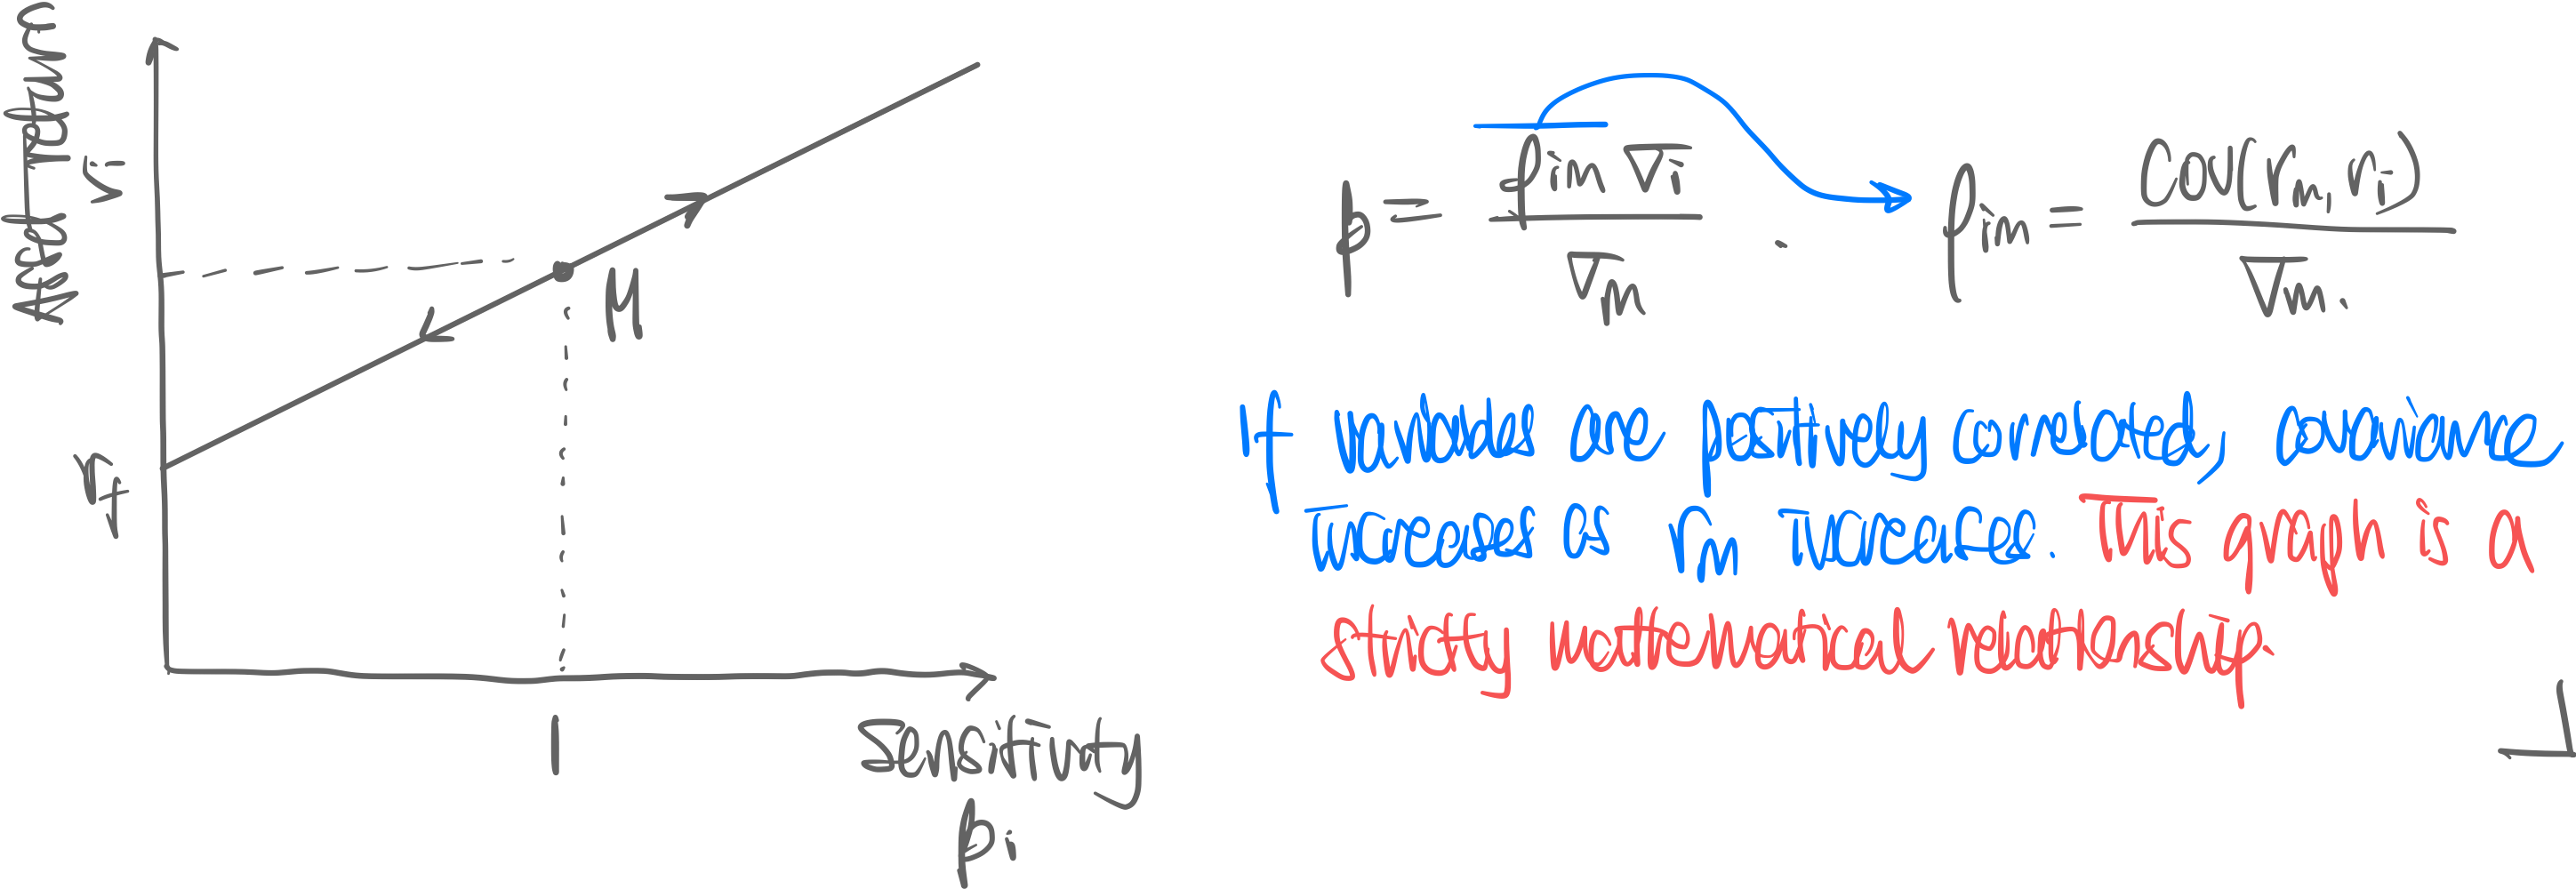
- is when the market is measuring against itself.
Risks. In the CAPM model, there are two types of risks we care about.
- Systematic Risk [=market risk, beta risk]. This is the risk due to the market recessions.
- Diversification cannot solve beta risk.
- High beta implies higher returns in good times, worse returns in bad times.
- Idiosyncratic Risk. This is the risk due to individual firms’ characteristics (tech, organization, etc.)
- Idiosyncratic risk i.e. diversification solves this
- Uncorrelated with market risk.
Industries that do well despite a recession: Pharmacuticals, Consumer necessities, Defense industries.
Technical Reference
Use terminology from Portfolio Theory (Markowitz).
- Market Beta: correlation of portfolio with market.
- Capital Allocation Line (CAL)
- Security
- Risk-free security
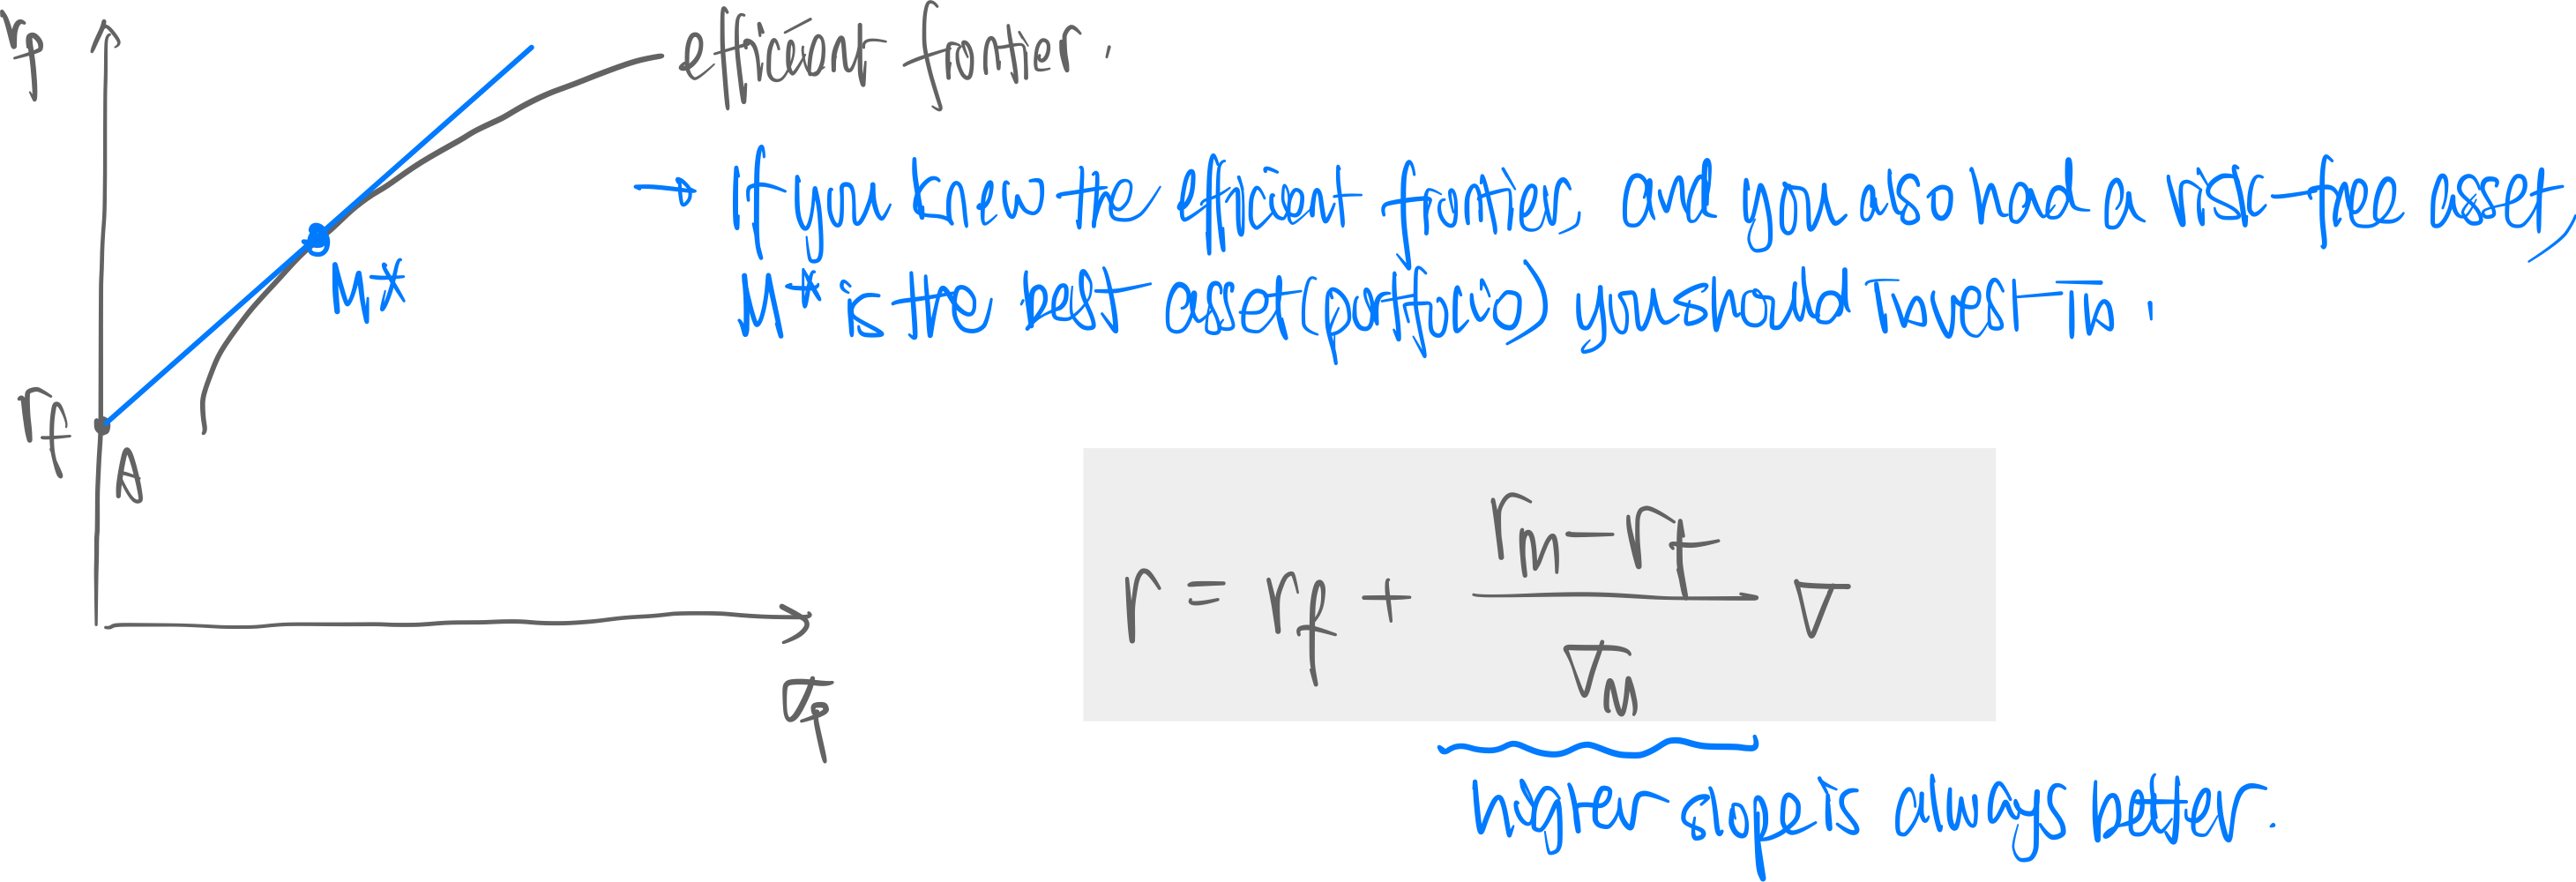
- Equation of Possible Portfolios (=Capital Allocation Line):
- This is a line ⇒ Capital Allocation Line.
- Slope:
- Higher slope (=higher Measuring Security Performance) is better (more return per unit risk)
- Capital Market Line (CML)
- Market Security
- Risk-free security
- Investor Utility Function
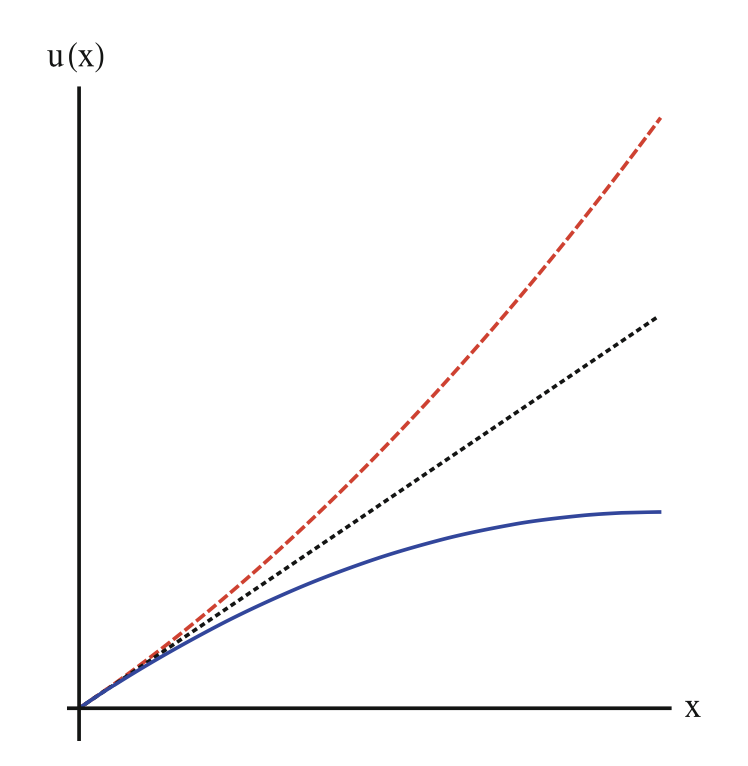
- Red: risk-seeking
- Black: risk-neutral
- Blue: risk-averse
-
- Lagrangian Optimization problem
⇒ to get optimal portfolio

- Lagrangian Optimization problem
⇒ to get optimal portfolio