Income Effect (IE) Substitution Effect (SE)
Combined Income/Substitution Effects
In cases where price of one good changes, income and substitution effects happen together. Imagine when gasoline prices rise:
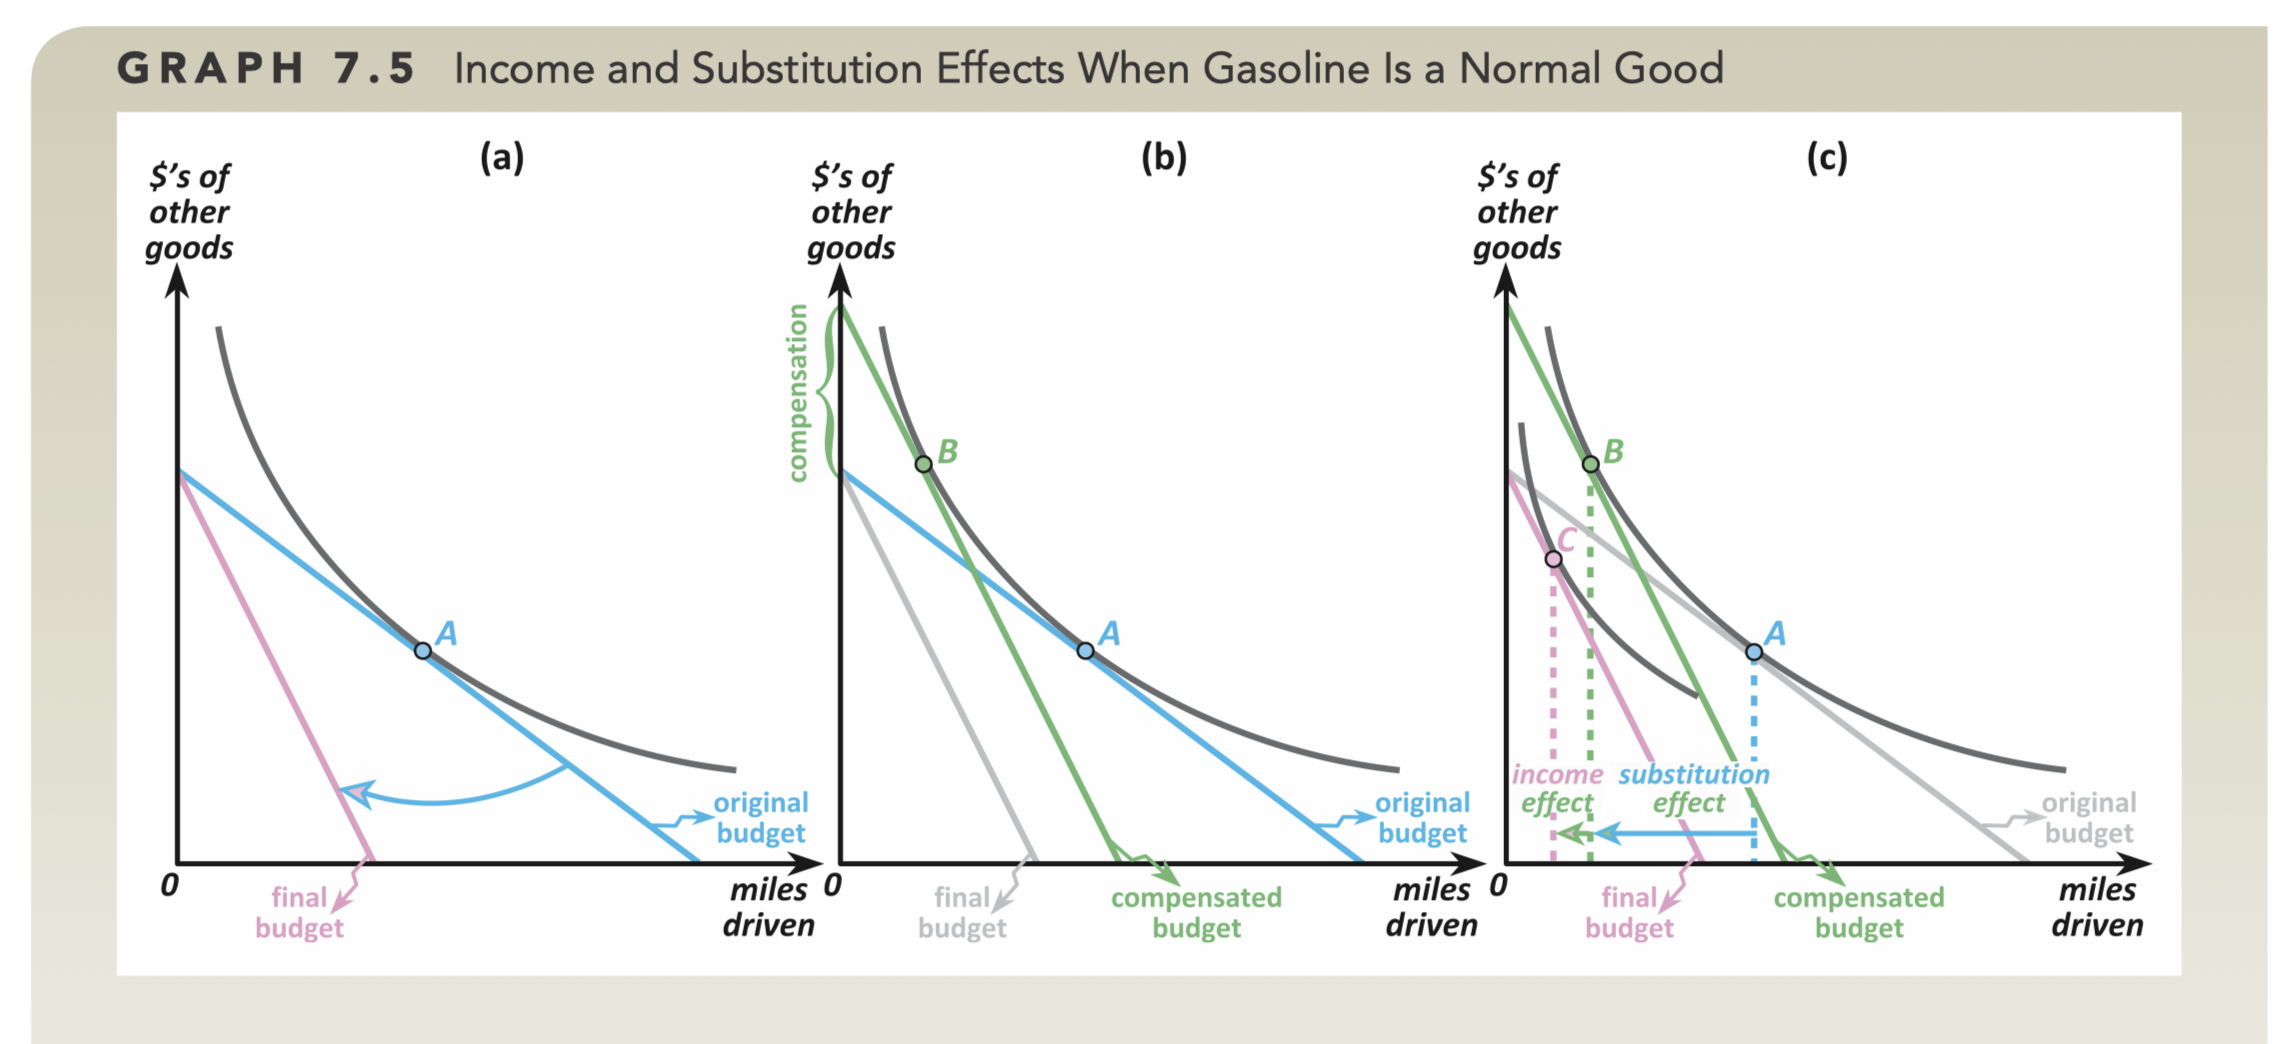
- Graph (a) shows the change in the budget line due to the increase in price of gasoline.
- Graph (b) shows the compensated budget line to maintain the level of utility.
- Graph (c) shows the ultimate, uncompensated bundle C.
The process for both effect is as follows
- Move along the same utility curve from bundle A → B; substitution effect
- Move to the new budget line from bundle B → C; income effect → this determines if good is normal (homo-thetic or not), quasi-linear, inferior; see below)
Income and Substitution Effects on Types of Goods
The above case was when gasoline was a normal good. When gasoline is inferior the move due to income effect (B → C) is to the right. The degree to which this occurs coincidentally determines if the good is regular inferior, or (the strange case of) a Giffen good.
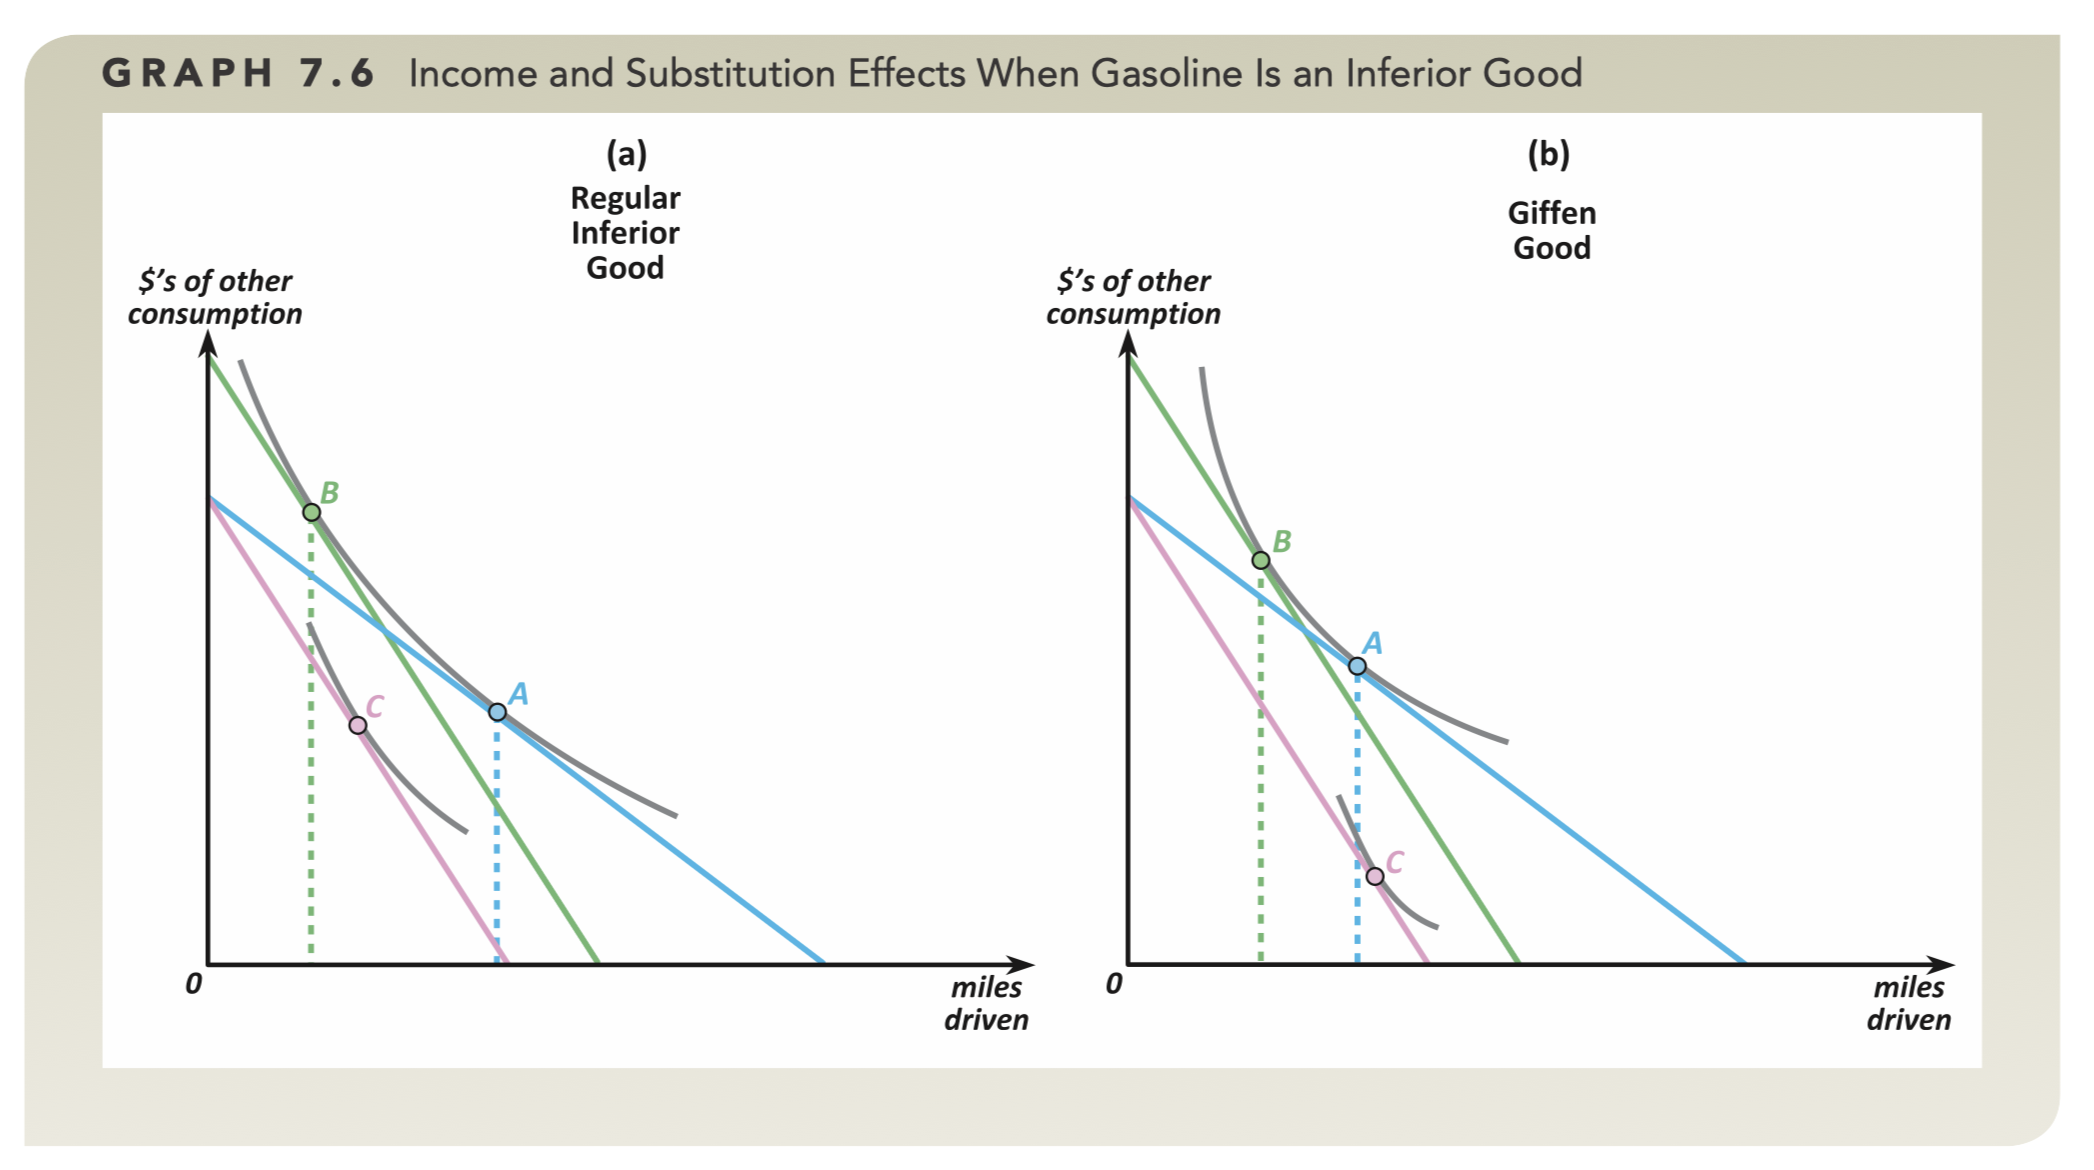
Observe that for both graphs B → C is a rightward move, because lowering income (blue → red) increased consumption, meaning this is an inferior good. If C has more of gasoline than A, it is the strange Giffen good.
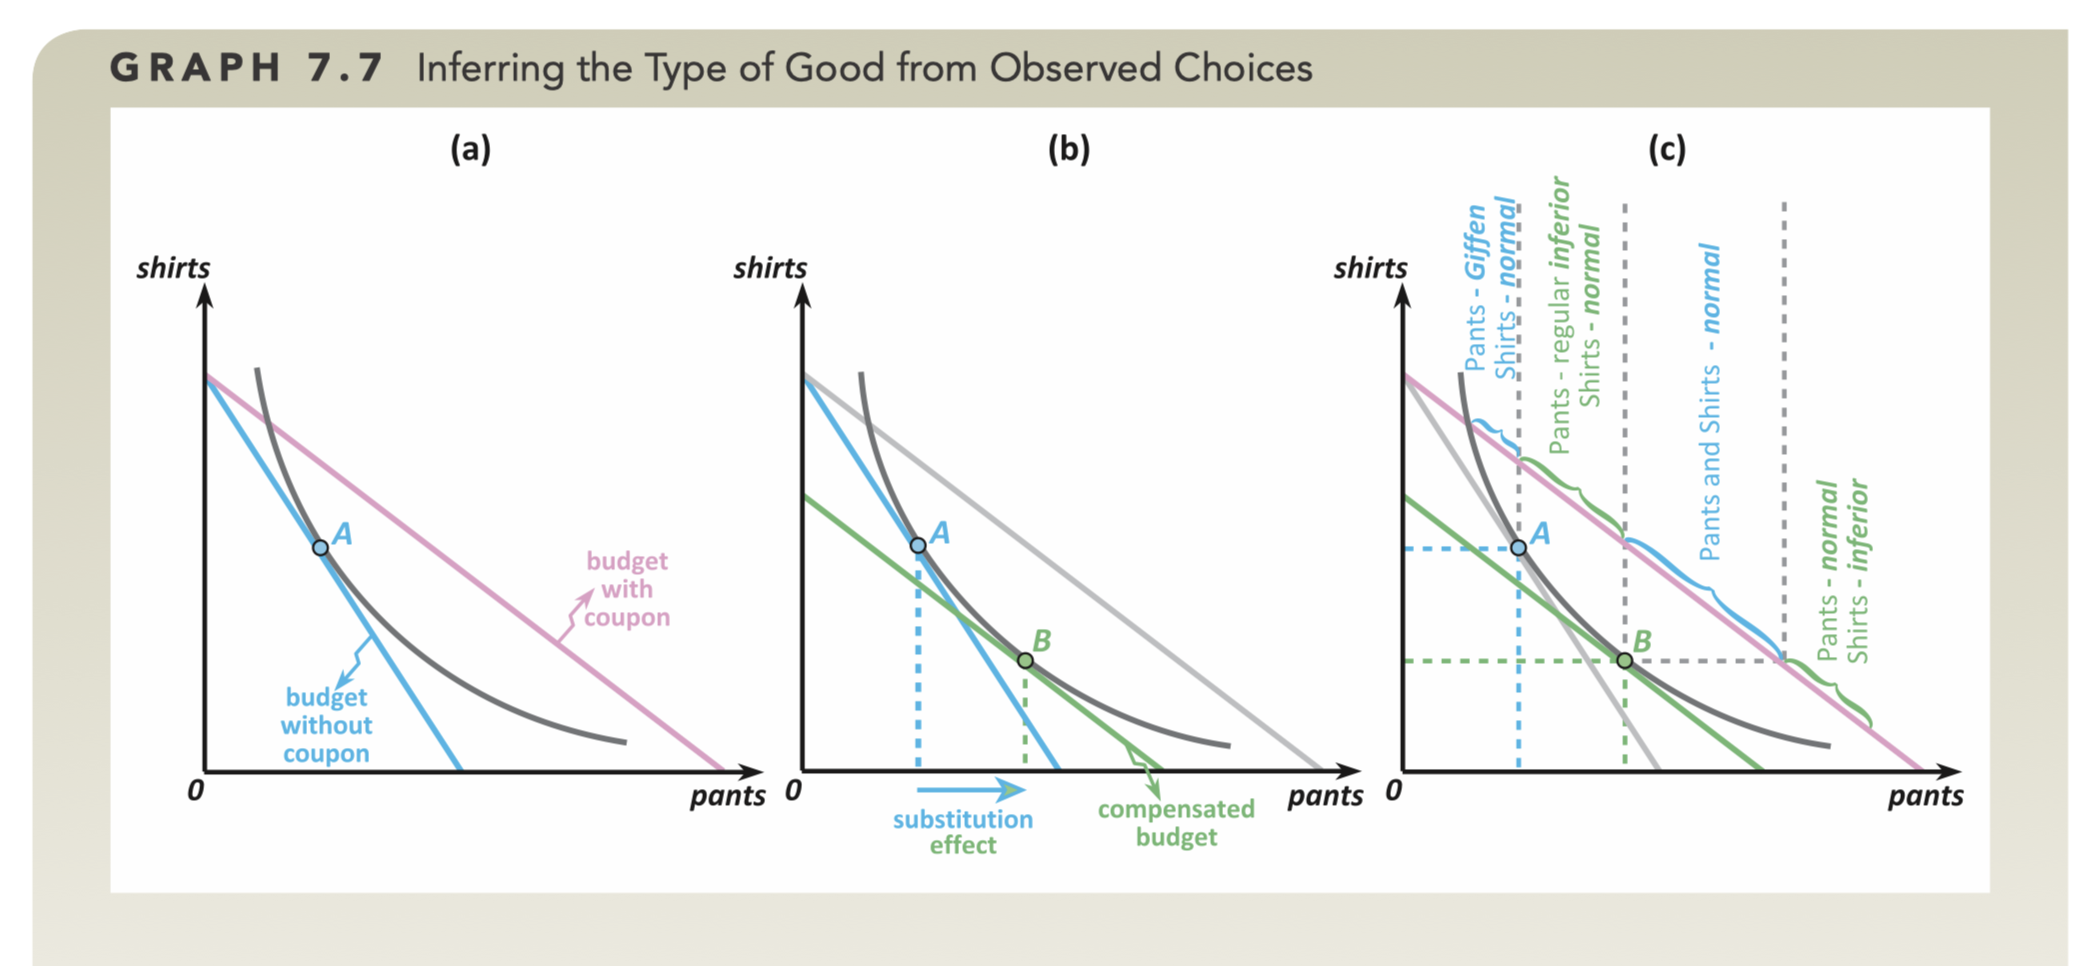
Bringing it Together
The final is combining all of these movements together. In the following graph, the consumer consumes only shirts and pants. Then they’re given a coupon that discounts the price of shirts (blue → red). Using the compensated budget we determine the substitution effect (b, A → B). Then, depending on whether shirts/pants are normal, inferior (or quasilinear) we can determine where the final income effect (B → C) will lie.
Mathematically…
Assume:
- Utility curve
- Budget line
- Your bundle ,
Then occurs a change in price , causing a change in the budget line from . Then, consider how much you should compensate your income, to stay in the same indifference curve with utility . That is, what is the minimum income that I can spend to reach a certain indifference curve?
Thus you find the bundle , with the size of the substitution effect
Since this compensated budget is a hypothetical scenario, we will need to move back to the original budget.
to find bundle .